EM12c Enterprise Monitoring, Part III
This is Part III in a multi-part series, demonstrating how to take EM12c from out of the box to enterprise level.
You can read Part I and Part II to complete the first phases of this setup and look for future posts in this series to ensure your EM12c is set up to support your database world.
Monitoring Templates
Monitoring templates, when created via an example database and then used as the default for all databases, allows the DBA control to create incidents and notify on what metrics are important to the business.
Creating a Template
As templates are used at the global level, we create a template by clicking on Enterprise à Monitoring à Monitoring Template.
There are no templates by default, but as they are based off existing databases, it is easy to create one. Click on “Create” to begin the Template wizard.
For our first Template, we are going to create one based off an existing “Host” target:
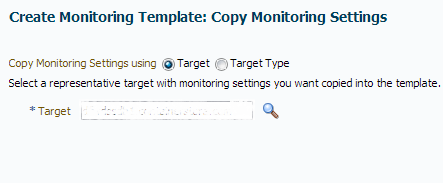
We leave the default “target” for our copy choice and then click on the magnifying glass to choose an existing host from our list of targets.
Name the template a clear name and add a description. Choose to make this the default template, (although you can also edit the template and add this later, but if you don’t, it will not be applied to future discovered targets of this type.)
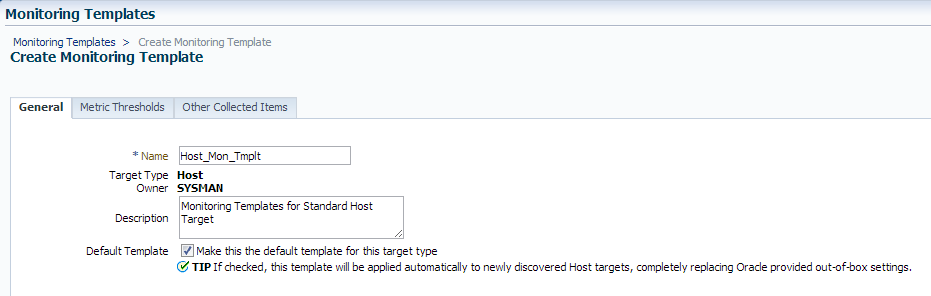
Click on the “Metric Thresholds” tab.
I recommend the following settings be applied to the host monitoring template:
| Threshold | Warning | Critical |
| Disk Device Busy (%) | 90 | |
| File system Space Available (%) | 20 | 5 |
| CPU Utilization (%) | 90 | |
| Memory Utilization (%) | 90 | |
| Swap Utilization | 90 |
There are rarely any critical metric thresholds. The DBAs main indicator for issues will be at the database level, not the host level, so critical alerting on these settings is removed and warning thresholds are increased to eliminate unnecessary incident creation in the EM12c console.
Save the template.
Single and Cluster Database Template
Click on “Create” to start the next template creation, first for a single database instance and then create a second template with the same metrics that you see in the table below, along with the additions shown in the cluster database metric table and use a cluster database for the source.
Again, choose the default target type and then click on the magnifying glass and choose a database instance, (single instance) and select it as the source for metrics to be sourced for the template.
Name the template a descriptive name and add a description and click in the check box to make it the default for all discovered targets of this type. Click on “Metric Thresholds” to now edit the metric values for warnings and critical.
Update or add the following values for metric thresholds:
| Metric | Warning | Critical |
| Archiver Hung Alert Log Error | ORA- | |
| Data Block Corruption Alert Log Error | ORA- | |
| Generic Alert Log Error | ORA-0*(600… | |
| Media Failure Alert Log Error | ORA- | |
| Session Terminated Alert Log Error | ORA- | |
| Archiver Hung Alert Log Error Status | 0 | |
| Data Block Corruption Alert Log Error Status | 0 | |
| Media Failure Alert Log Error Status | 0 | |
| Session Terminated Alert Log Error Status | 0 | |
| Archive Area Used (%) | 80 | 97 |
| Broken Job Count | 0 | |
| Failed Job Count | 0 | |
| Database Vault *(3 total) | 0 | |
| Data Failure Detected | .* | |
| Deferred Transaction Count | 100 | |
| Deferred Transaction Error Count | 0 | |
| Dump Area Used (%) | 80 | 97 |
| Exadata- Error Code | 0 | |
| Failed logins | 150 | |
| Incident- Access Violation | .* | |
| Cluster Error | .* | |
| Deadlock | .* | |
| File Access Error | .* | |
| Generic Incident | .* | |
| Generic Internal Error | .* | |
| Inconsistent DB State | .* | |
| Internal SQL Error | .* | |
| Oracle Data Block Corruption | .* | |
| Out of Memory | .* | |
| Redo Log Corruption | .* | |
| Session Terminated | .* | |
| Need to Instrument with OCM | 1 | |
| Op Error- Archiver Hung | .* | |
| Data Block Corruption | .* | |
| Generic Operational Errors | .* | |
| Media Failure | .* | |
| Database Status | Mounted | Down|Unknown |
| Streams Process Errors | 0 | |
| Streams Process Status | Disabled | Aborted |
| Tablespace Space Used | 85 | 95 |
| Tablespace Space Used(Dict) | 85 | 95 |
| Segments Approaching Max | 0 | |
| Segments Not Able to Extend | 0 | |
| Temporary File Status-Status | OFFLINE | |
| User Audit- Audited User | SYS | |
| Metric | Warning | Critical |
| Database Service Status | Up with Warning | Down |
Save the template after completing the updates/changes to the metric thresholds.
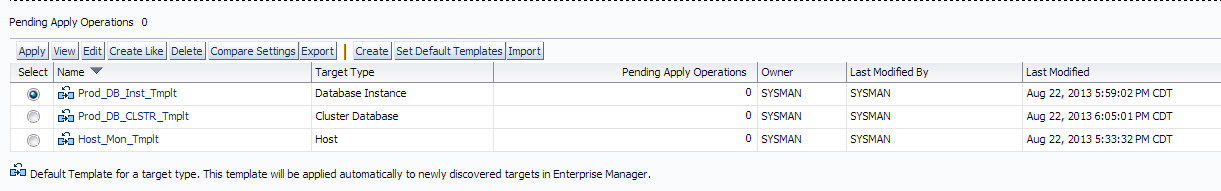
You should now have three monitoring templates- one for host and then one for single database instance and another for cluster. You can add others as required by the business, but these are the three required to alert of CRITICAL only issues and create incidents for managing during business hours of warning thresholds on metrics. As these are “default” templates, any new targets added for these target types will automatically “adopt” these metric settings and thresholds.
Next, Part IV- Incident Rule Sets
Pingback: EM12c Enterprise Monitoring, Part II | DBA Kevlar
Pingback: EM12c Enterprise Monitoring, Part III - Oracle - Oracle - Toad World
Pingback: EM12c Enterprise Monitoring, Part IV | DBA Kevlar
Hi Kellyn,
I am adding metrics to rules but noticed that the same metric appears in different groups like Alert Log and DB Alert Log – for example many of %error% metrics. Do you know what is the difference in between them? Which one should be added let’s say for standalone database?
Thanks,
Andrey
Hi Andrey,
Retain the Alert Log, but think carefully about what you are alerting as critical on alert log messages. You’ll often see redundancy when the database experiences an error, then this same error writes to the alert log. If it makes more sense to alert on less error codes and allow other metrics alert you, then do so. To test this out, move the codes to “Warning” and have them write to warning, too, creating an incident for warning metrics for the Alert log. Once you see a duplicate, remove it from the “Critical” metric value threshold and leave it in the warning so you’re only notifying once per issue.
Hope this helps, but let me know if you need a little more, this is a complex topic.
Kellyn
Hi Kellyn, Great website btw.
When you have created these templates and come to apply them to a database/server/cluster, are you expecting to replace the monitoring already in place or just override the given metrics? Sorry if you’ve already mentioned this somewhere. I did look but I couldn’t find the answer. I know this is a matter of choice but as your blog is advising best practices with these templates it would be great to know what you would do.
thanks
Dafo
I expect to replace the existing monitoring with these templates and to create default templates. Now there are specific metrics that I will override if they then return with notifications that show they must be set outside of the template thresholds. You can set these to NOT be over-ridden by a template, which will guarantee that they stay even when a template is in place or created later on.
Pingback: EM12c Release 4, Private Roles - Oracle - Oracle - Toad World
Hi Kellyn,
First time posting here, but reading your blog for a few weeks. I have created the Templates for target-types (Cluster, Instance, Host) with many of the same metrics you have chosen. I am not sure yet if your response to Dafodill answers my question, therefore, here’s my question:
I have a number of pre-existing Hosts, pre-existing single-non-rac instances, and a few Database Clusters already discovered. Now that I have created the templates, how do I apply the monitoring templates to my already discovered (hosts, instances, clusters)?
Thanks,
Khalid
Pingback: OEM Incident: Critical Alerts Part 2: Reducing Alerts | @dba_jay