EM12c- Managing Incidents, Stopping the Insanity, Part I
As many folks know, “white noise” or having incident alerts that don’t offer value is something that I just refuse to tolerate.
The metric alert “Listener response to a TNS ping is xxxx msecs” is valuable, as it represents how many milliseconds it takes the listener to respond to a network request, (i.e. ping).
In the EM12c metric settings, this is set to default threshold of 400 to signal a warning and 1000 for critical. For most Listener targets, this is a solid set of thresholds, but that isn’t always the case. There are advanced logic capabilities involved with EM12c metrics, allowing anyone to set the threshold for a given metric to a unique value and even require the threshold to be reached X number of times before initiating the response set in the incident rule set.
This offers the EM12c administrator customization settings unique for targets that regularly experience delays in a network request. Instead of having “white noise”, (i.e. constant and annoying incident nofitications), you can customize the metric settings so to only notify if there is a real issue.
If you are receiving an incident notification for this type of metric, then it’s going to look very similar to the following:
Host=host.domain.com
Target type=Listener
Target name=LISTENER_HOST
Message=Listener response to a TNS ping is 4,380 msecs
Severity=Critical
Event reported time=Nov 22, 2013 10:04:56 AM CST
Operating System=Linux
Platform=x86_64
Associated Incident Id=47082
Associated Incident Status=New
Associated Incident Owner=SYSMAN
Associated Incident Acknowledged By Owner=No
Associated Incident Priority=Very High
Associated Incident Escalation Level=0
Event Type=Metric Alert
Event name=Response:tnsPing
Metric Group=Response
Metric=Response Time (msec)
Metric value=4380
Key Value=
Rule Name={client]_Incident Management Ruleset,Incident creation Rule for metric alerts.
Rule Owner=SYSMAN
Update Details:
Listener response to a TNS ping is 4,380 msecs
Incident created by rule (Name = TCS Incident Management Ruleset, Incident creation Rule for metric alerts.; Owner = SYSMAN).
To address an incident that is not offering significant value, you have multiple ways to pursue it, but we’re going to work through this with the concept that we want to review historical data and make an intelligent decision about what the thresholds need to be set for this metric.
1. Click on the link in the “Message”, which will take you to the Listener target summary page:
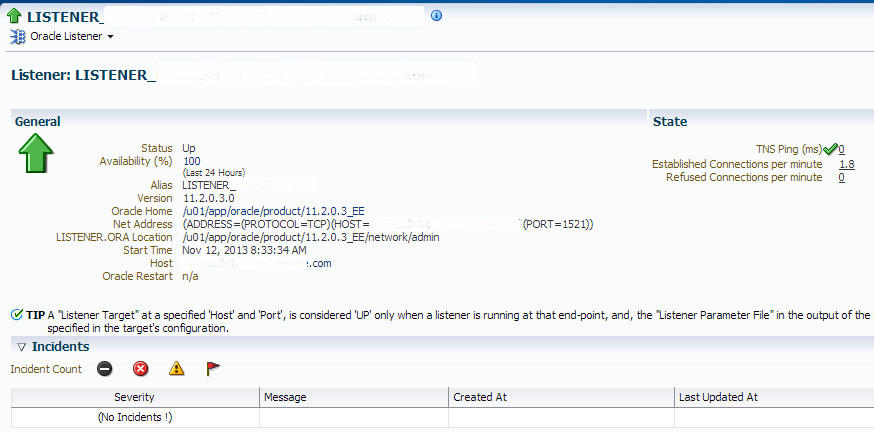
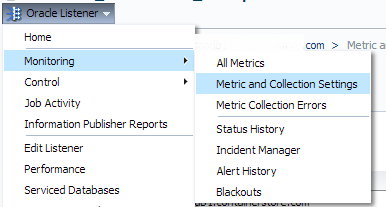
Don’t be surprised if there isn’t an incident shown in the “Incidents” section. The intermittent network response issue is already gone and the incident is cleared. To locate this incident and see how often it occurs, Click on drop down in the upper left, “Oracle Listener”, “Monitoring” and “Alert History”:

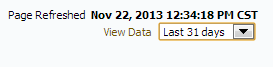
This will then show you the alert history for just this target. Now the first thing you are going to want to do is get a solid view of the history. The default view is for the last 24hrs. In the upper right hand corner, change the view so that it displays the last 31 days:
You will now display a more complete view of how often the metric has alerted, both for warning and critical:
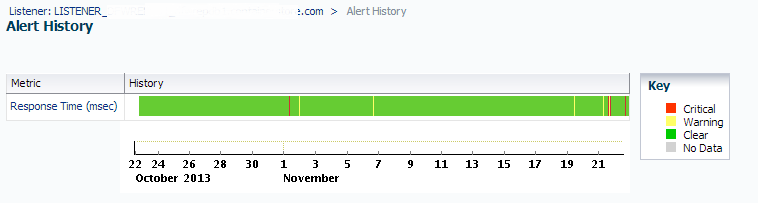
You can now determine if this metric, at its current settings are offering you the best value in information. For the above example, we’re dissatisfied with the amount of notification generation and due to increased network traffic, the decision is to increase the values so that it only alerts when the ping is at a level that there really is an issue to respond to.
First, I’ll investigate the incident history collected by EM12c. This will let me view the actual highs and lows over periods of time and justify what the warning and critical thresholds should be for this servers Listener response time. To do this, (there are a number of ways to reach this, but remember, we’re in the mode of logical investigation and response steps…) I move my cursor to where one of the critical alert sections are in the Response time bar, (either a yellow or red line you see in the graphic above…) and double click on it, which then bring me to the indicent history data:
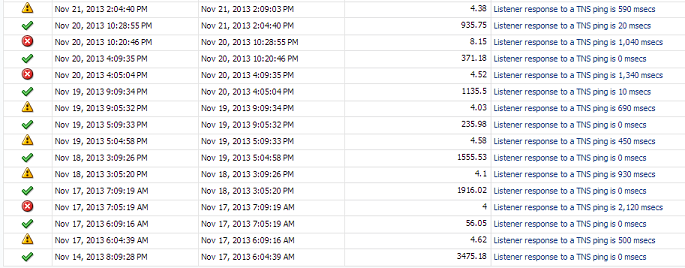
We can see that some of the response times in just the last week have been quite high. Look for what values make sense for warnings and critical values. Now it’s time to view the actual metric settings and see what the Enterprise Manager has set for thresholds.
Click on “Oracle Listener”, “Monitoring” and “Metric and Collection Settings”:
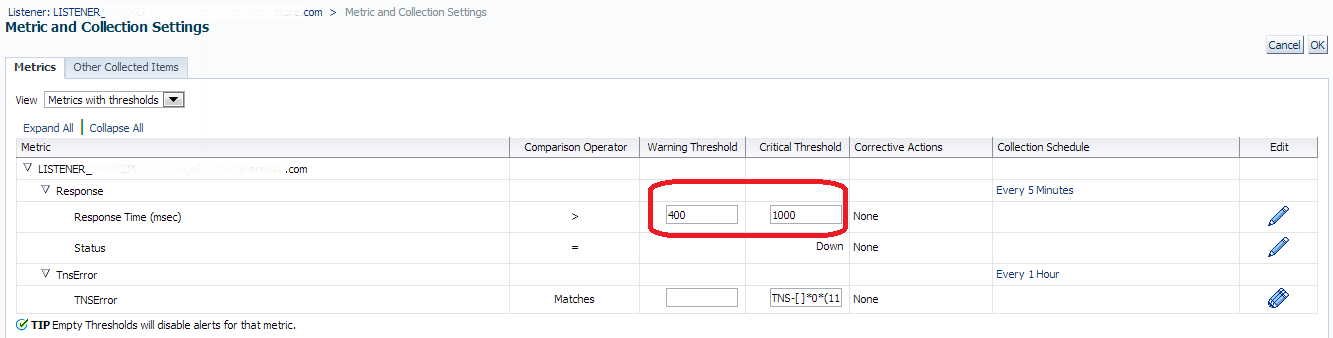
Please Note: This will take you to the metric and collection settings for just THIS listener. Keep in mind when editing this section you are ONLY editing the listener that you are currently working on and no other listener on any other target will be effected.
Default settings of 400 for warning and 1000 for critical are currently in place. We can now update this by clicking on the “Pencil” icon to the right of the metric thresholds:
Scroll to the bottom of the page and you will find the “Threshold Suggestion” feature. This feature can now take what you’ve already noted in your investigations and you can test the new thresholds against the target’s history. The default display will show you the current settings and how they are impacting, so you’ll be offered another view of how effective or ineffective the current metric thresholds are. Change the values for warning and threshold to what you believe will offer you the best informational results and change the “View Data” to 31 days so you can compare it against the max amount of history:

As you can see, these new values offer thresholds that make sense for the demand on the host and will hit the warning threshold once during our historical view. If you aren’t satisfied with the response in the test, continue to change the metric thresholds until you see the response desired.
Once satisfied, now scroll back up to the top and set the actual thresholds for the metric.

Notice that I’ve also asked the Enterprise Manager NOT to respond unless this threshold has been reached by either warning or critical THREE TIMES in the “Number of Occurrences” section and I’ve also check marked the box to stop any Template Override. We’ve already investigated and decided the metric threshold for this target needed to be higher, so why would I want a monitoring template to override it and undo all my hard work? 🙂
Once I’ve made these changes, I click the “Continue” button. I’m then returned to the Listener Metric and Collection Settings page. The actual changes are not saved until I hit the “OK” on this page.
This metric has now been updated to effectively notify with thresholds that now make sense. Congratulations- white noise eliminated from this target… 🙂
“As many folks know, white noise or having incident alerts that don’t offer value is something that I just refuse to tolerate.” – Ha, sometime you’ll have to tell me more about how you’ve managed to do this with EM12c. If there’s one thing that drives me nuts, it seems like OEM doesn’t always make this easy! In particular I’ve found HAS and Cluster targets to be very unnecessarily chatty, even sending messages about other servers. So I’ll blackout a server during a maintenance window and then another server in the cluster will send me a bunch of messages about the blacked out server.
EM Queen,
How can an incident be suppressed from alerting/paging? We have a known bug and pages every weekend at 1am and then 30m later. Much grateful.
Can you offer me more information on the actual incident? Feel free to email me if there is any information that shouldn’t be public and I’ll assist, as there are a number of ways that this could be handled.
Thanks!
Kellyn
Pingback: Cloud Control your metrics with monitoring templates
Pingback: Cloud Control your metrics with monitoring templates | oracle infra stuff...mostly
hi kellyn,
thank you for the great post…one quick question i had for you is below…
you mentioned this
“This will take you to the metric and collection settings for just THIS listener. Keep in mind when editing this section you are ONLY editing the listener that you are currently working on and no other listener on any other target will be effected.”
is there is way to do this at template level so i do not have to go to each and every host and change those values ?
Yes, you can use this listener as a “source” for a template- create a monitoring template for this target type and choose this listener after you have it set up the way you need for the source of your monitoring template. Make any adjustments that are needed over the existing, then save and apply that monitoring template to the environment. As a default template, it will apply to all new target types that match it. If you don’t apply to the existing after you’ve created it, then it will only work for the new targets discovered that match the target type.
Thanks,
Kellyn
Thank you for the post.
Also, it may be connected with note id [372959.1]