EM12c- Managing Incidents, Stopping the Insanity, Part III
Nothing is more annoying that getting alerted on things that are not critical to you or that you already know is occurring and there is not a darn thing you can do about it.
I’ve also been frustrated to wake up in the morning and to see my inbox flooded with a ton of alerts from numerous EM12c systems and really- none of them are truly critical, but can appear to be simply overwhelming!
How to we steer the inbox from madness to manageable?
The answer to this question is not just managing metric settings and thresholds- there are a number of different ways to control what end up in your inbox or alerting you at every waking and sleeping hour.
The part in this series is focused on fine grain rule sets. This is a post that will show you how in a few, simple steps, with the hopes that you can recreate this as simple or complex as you wish, based to make your EM12c server you better.
Note: This next post is a change, that as I said, is about changing a rule set- Remember- changing a rule set is a change to ALL targets utilizing the rule set, vs. changing a metric policy or threshold at a target level, so think through what you want to change and how you want to make the change BEFORE you make the change. All options I show you here can be performed in many, many different ways to address the problem. Rationally think about the change you need to make, test it out and use common sense.
So for our email today, one of my clients systems have started to send this incident to my inbox at night:
 Host=hostxyz.client7.com
 Target type=Oracle Management Service
 Target name=hostxyz.client7.com:4892_Management_Service
 Categories=Performance
 Message=Loader Throughput (rows per second) for Loader_D exceeded the critical threshold (75). Current value: 65.08
 Severity=Critical
 Event reported time=Dec 4, 2013 8:50:10 AM CST
 Operating System=Linux
 Platform=x86_64
 Associated Incident Id=51218
 Associated Incident Status=New
 Associated Incident Owner=SYSMAN
 Associated Incident Acknowledged By Owner=No
 Associated Incident Priority=Very High
 Associated Incident Escalation Level=0
 Event Type=Metric Alert
 Event name=Management_Loader_Status:load_processing
 Metric Group=Active Loader Status
 Metric=Loader Throughput (rows per second)
 Metric value=65.08
 Key Value=Loader_D
 Key Column 1=Loader Name
 Rule Name= Incident Management Ruleset,Incident creation Rule for metric alerts.
 Rule Owner=SYSMAN
 Update Details:
 Loader Throughput (rows per second) for Loader_D exceeded the critical threshold (75). Current value: 65.08
 Incident created by rule (Name = Incident Management Ruleset, Incident creation Rule for metric alerts.; Owner = SYSMAN).
I could really care less about this and am already receiving this information once it hits the warning threshold for review. I don’t want to be woke up in the middle of the night, nor is it something that I can really address as a critical outage for this client.
Let’s edit our rule set by taking the information offered us in the email from the “Rule Name” section:
Rule Name= Incident Management Ruleset,Incident creation Rule for metric alerts.
Incident Rule Sets
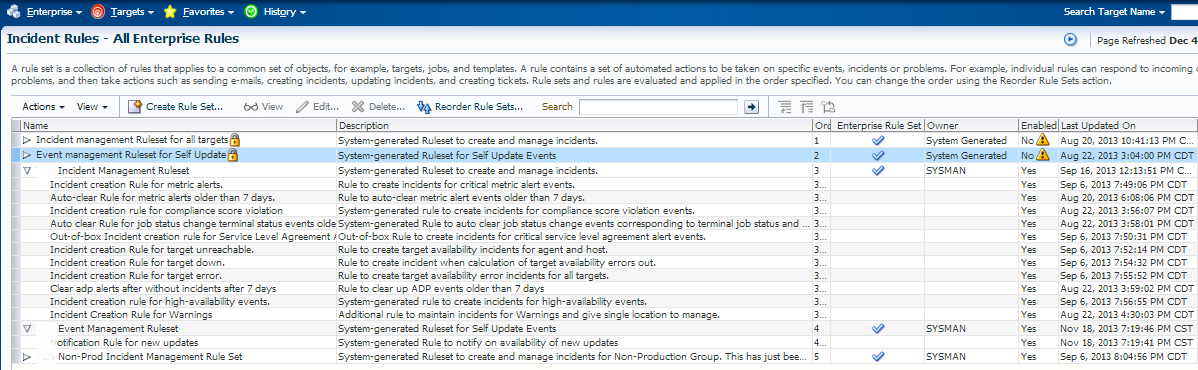
Log into the EM12c and click on “Setup”, “Incidents” and then “Incident Rules”
You should see your Incident Rule Sets listed.
We’ll take the following information from our Incident email we recevied:
Rule Name= Incident Management Ruleset,Incident creation Rule for metric alerts.
and then one more section, “Categories”, (remember, some Incidents can belong to more than one category):
Categories=Performance
Taking just these two lines above, this tells us what incident rule is alerting us. What we may not realize, is that by default, critical metric alerts notify on ALL categories and you then distinguish this by rule set, by target, by group, etc. This is where the EM12c again proves itself to be a self-service product, giving the power to the administrator to receive notifications on any incident in the way that they want to receive or NOT receive.
Armed with this information, we are now going to take this example for our client and edit the rule set-
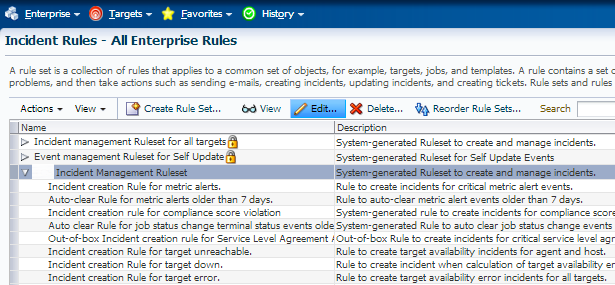
We’ve highlighted the rule set that matches the first part of the Rule name “combination” and click on Edit.
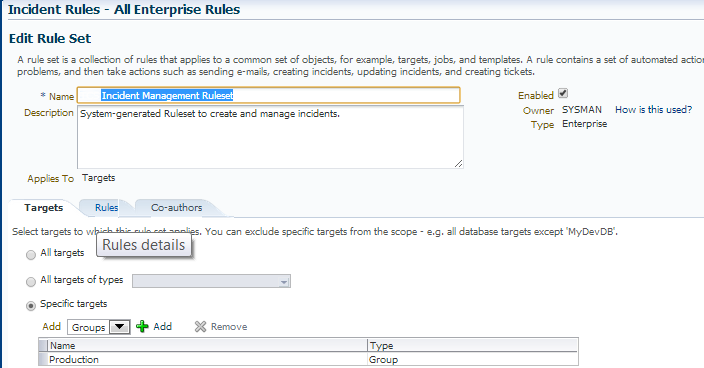
Then upon entering the info for the rule set, we’ll need to edit the actual rule, which is the second part of the combination offered in the “Rule Name” from the email. Click on the Rule Tab, the rule which we wish to edit, then click on “Edit”.
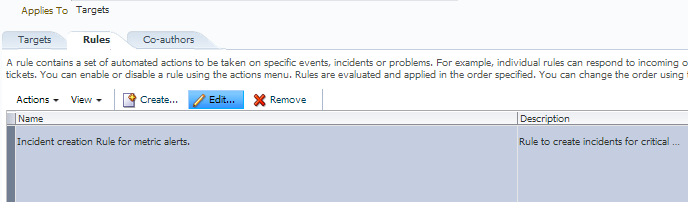
This will take you into the rules basic information on what it uses for requirements it needs to trigger an incident.
By default, most rules are created to be triggered by very simple choices-
- Type of Alert, in this case- Metric Alert
- Severity, in this case- Critical
All other granularity has been left wide open, but you can change this and finely tune the granularity.
Now in the above email, we are told that the Category involved is “Performance”, but we really don’t want this waking us up in the middle of the night, as-
1. This may be a server that regularly has high resource usage.
2. It’s not a critical “pending outage” issue, but an issue that we would need to investigate in the morning or may already be a known issue that is scheduled to be addressed.
To address the emails, we are going to make two changes.
1. Only email on what is mission critical outage issues for Metric Alerts
2. Create a new rule that will create an incident for any categories that are outside of what we want to be notified of for metric alerts.
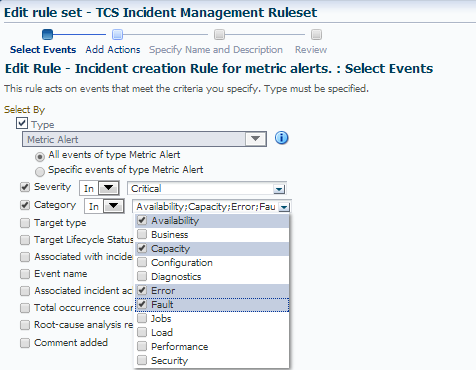
As you can see in the above example, I’ve added a check-mark for the Category and chosen the following:
- Availability
- Capacity
- Error
- Fault
I can then click on Next and Save the change.
We still have the other categories that are important to us, but we just don’t want them emailing anymore. I want them to create an incident and I’ll review them when I review my Incident Manager, as I’ve been a strong proponent of using the Incident manager in this manner.
Create a New Rule for Category Level Metric Alert Coverage
We have now returned to the Rules that make up the Rule Set- Click on “Create” to create a new rule. We are going to create a rule very similar to the one we just edited, (just in case you need an example to use as a reference…) but we are going to choose the other categories and have the rule handle these categories of Metric Alerts incidents differently.
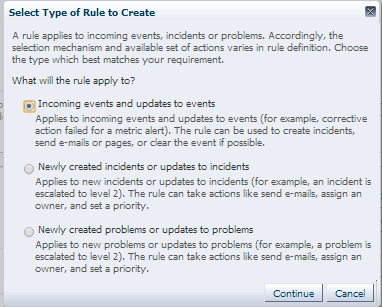
Choose the default radio button, “Incoming events and updates to events” and click Continue, which will take you to the rule wizard.
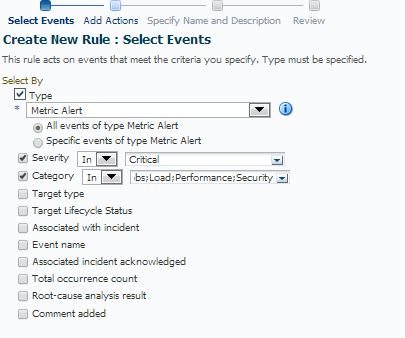
For this rule, we choose the following:
- Type: Metric Alert
- Severity: Critical
- Category: All the categories we didn’t choose for our rule that is still in place.
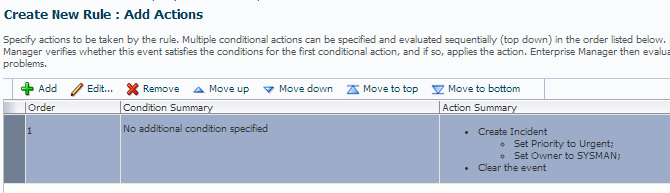
Click on Next to proceed to the next set the step of actions when the Metric is triggered in the wizard:
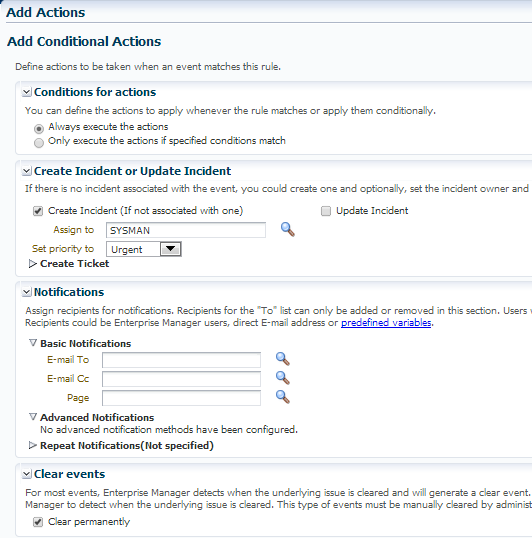
We want the EM to ALWAYS perform the actions when a metric alert for these categories are triggered, so leave the default here.
To save us time and energy, I believe is automating the assignment of the metric alerts and other common incident.
- Assign to SYSMAN or a User created for this purpose in the EM12c. You can even assign a specific email address if one person or group are in charge of addressing these types of incidents, (more options, more options… :))
- This is still critical, so assign the priority to “Urgent” or “Very High”.
We want these categories to NOT email, so skip the email section.
Choose to clear events permanently, unless you wish to retain this data.
Proceed to the next section of the wizard, where you can review your Condition and Action Summary.
Click to proceed to the next screen and add a meaningful name for your rule and a meaningful description-
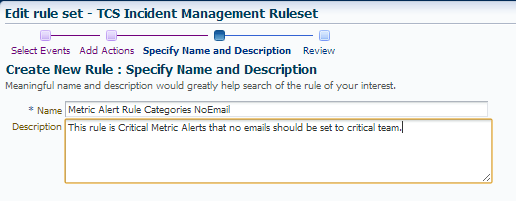
Click on Save and then you will need to click on OK to save the rule to your existing rule set.
By following this process, we have
1. Removed specific categories from emailing from a specific rule so that only critical “possible” production outage incidents are going to email/paging.
2. Added a second rule to handle those categories no longer in the original and to create incidents for review when appropriate time.
This could easily be built out so that a unique user is created with an email address to page uniquely and only assign mission critical, production OUTAGE to alert.
One rule could handle this for just production admin group, one business line, etc. to happen only after hours by editing the notification schedule.
You have the power in your hands to build out your Enterprise Manager 12c environment in the way you need it to support you and to do what your business needs to be more productive.
How do we know what metrics belong to each of these categories? How do we relate these to the metric settings in our monitoring templates? For example, I want to be alerted if the archiver hangs or the FRA fills us. How do I verify that these metrics do not belong to one of the categories I am not selecting for alerts?
Hi Christine,
This is where it is important to learn the SYSMAN views. The MGMT$METRIC_CATEGORIES has the information you are looking for:
SQL> desc sysman.MGMT$METRIC_CATEGORIES
Name Null? Type
—————————————————————– ——– —
TARGET_TYPE NOT NULL VARCHAR2(64)
TYPE_VERSION NOT NULL VARCHAR2(8)
METRIC_NAME VARCHAR2(64)
METRIC_COLUMN VARCHAR2(64)
METRIC_GUID RAW(16)
METRIC_CLASS_NAME NOT NULL VARCHAR2(64)
METRIC_CATEGORY_NAME NOT NULL VARCHAR2(64)
METRIC_CATEGORY_NLSID VARCHAR2(64)
The data is not stored in all upper case, so querying a few columns can assist the DBA in knowing what values they might want to search for, along with the format.
To start, we want to look at the Metric Categories that we are interested in:
select distinct(metric_category_name) from sysman.mgmt$metric_categories;
Response
Availability
Capacity
Usage
Performance
Business
Utilization
Configuration
Fault
Load
Error
LoadType
Security
From this, we can inspect what metrics are part of the “Error” category for an Oracle Database target type:
select metric_name, metric_column, metric_class_name from sysman.mgmt$metric_categories
where metric_category_name=’Error’
and target_type=’oracle_database’
…….
db_invalidObjects
object_name
Default
all_invalid_objects
total_count
Default
dbjob_status
failed
Default
Suspended_Session
Data_Object
Default
Suspended_Session
Quota
Default
82 rows selected.
This thread is very helpful. My incident emails were out of control until I took your advice.
Yes and I forgot to say thank you Kellyn on your response. It was quite helpful!
No problem at all. I wish I had more time to respond to requests!
Kellyn
Hi, Kellyn.
I was glad to meet you at RMOUG Training Days. Fantastic Conference!!! I really enjoyed your presentation on “Social Media for the Techie!!” with @that_jeffsmith. I started my own Twitter page as a result although I haven’t posted much as of yet. @dba_jay
I was not sure how to start a new thread on your blog but I came up with an issue on OEM12C (Scheduling RMAN Jobs). If you would rather move this to a new thread, that would be great.
On each database with OEM12C, you are allowed to choose whether to connect to the catalog or connect using control file. I originally set up each of my databases to connect to the catalog to run all of my RMAN jobs. That worked great until I set up a standby database on my RMAN repository database. When I perform a “Switchover” and include scheduled jobs, all of my RMAN jobs fail due to inability to connect to the catalog database. I have a couple of choices on how to proceed.
1> Manually change the catalog to the standby database which is the new primary. This could be complicated in the case of a failover.
2> Change the RMAN OEM12C setting to connect using the control file. This is problematic for two reasons:
A) I now have to strip out the “RESYNC CATALOG” out of my CROSSCHECK jobs and create a new job called “RESYNC ALL”.
B) This new job fails when trying to connect to the catalog with the following errors:
RMAN> connect catalog *
RMAN-00571: ===========================================================
RMAN-00569: =============== ERROR MESSAGE STACK FOLLOWS ===============
RMAN-00571: ===========================================================
RMAN-06445: cannot connect to recovery catalog after NOCATALOG has been used
RMAN> resync catalog;
RMAN-00571: ===========================================================
RMAN-00569: =============== ERROR MESSAGE STACK FOLLOWS ===============
RMAN-00571: ===========================================================
RMAN-03002: failure of resync command at 02/18/2014 08:44:19
RMAN-06002: command not allowed when not connected to a recovery catalog
3> The third option, which will work but is not preferred, is to run this job through CRON. I am trying to get away from CRON because these jobs are harder to track. I prefer to have a single point to run all of my backups.
Any advice would be greatly appreciated!!
Thanks,
Jason Brown
Follow me on Twitter!! @dba_jay