Using ASH Analytics to View Blocked Sessions
When concurrency is the crippling factor in a database performance issue, often I’m told that viewing blocked sessions in Enterprise Manager is difficult. The query behind, along with flash image generation in any Enterprise Manager can take considerable time to render and no matter how valuable the view is, the wait is something DBAs just can’t hold out for when needing the answer now.
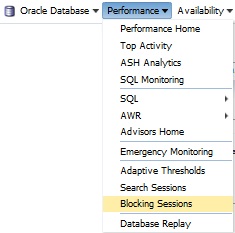
Blocking Sessions View in OEM
If you’re wondering which feature I’m speaking of, once you log into any database, click on Performance, Blocking Sessions.
If there aren’t any or any significant load on the database, it can return quite quickly. If there is significant load and blocking sessions, well, you could be waiting quite some time….
Behind the Scenes
The query that is run behind the scenes will be executed by the DBNSMP, (or whatever user you have configured for use from a target to communicate with the OEM) to the database in question and will look like the following:
selectsid,username,serial#,process,nvl(sql_id,0),sql_address,blocking_session,
wait_class,event,p1,p2,p3,seconds_in_wait
 fromv$session
 whereblocking_session_status='VALID' OR sid IN
 (selectblocking_session
 fromv$session
 whereblocking_session_status='VALID')
So what do you do when you need blocking information quickly and can’t wait for the Enterprise Manager Blocking Sessions screen? Use ASH Analytics to view blocking session information!
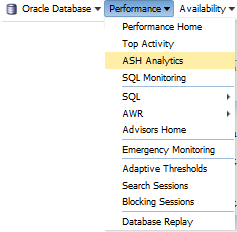
ASH Analytics View Options
Start out by telling me you have installed ASH Analytics in your databases, right? If not, please do this, it’s well worth the short time to install the support package and view via an EM Job for this valuable feature.
Next, once its installed or if you’ve already installed it, then for any database target Home Page in the EM12c, click on Performance, ASH Analytics.
The default timeline will come up for ASH Analytics. If the blocking is occurring now, no change to the time window will be required and you’ll simply scroll down to the middle wait events graph.
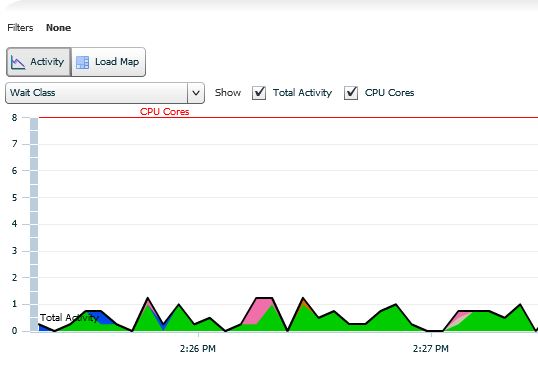
Notice that no filters or session data is present on the current graph and it’s focused on the standard Wait Class data. This can be updated to view blocking sessions and offer very clear info on the sessions and waits involved by doing the following quick changes:
Switch to
- Load Map from Top Activity
- Switched to Advanced Mode
- Chose the following Dimensions of data to display
You will see the following data displayed instantly on the screen, without the wait.
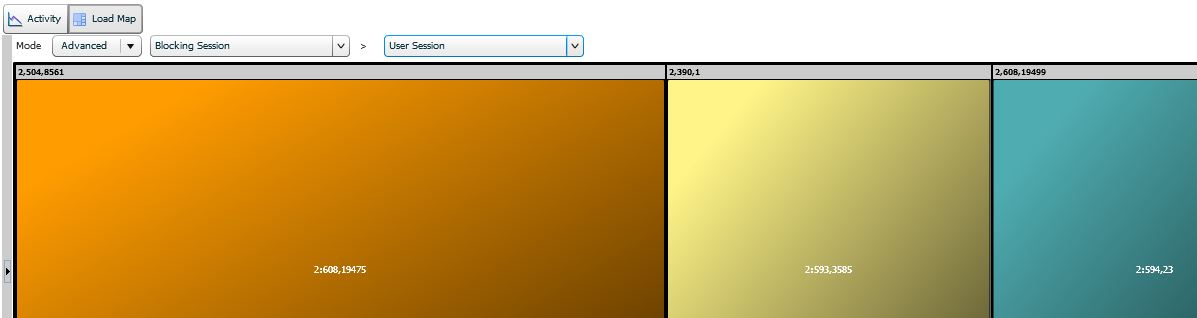
You will see the blocking sessions and below, will be displayed the sessions blocked for each. If there is more than one session blocked, it will show as a second, third, fourth box, etc. under the blocking session ID.
Advanced Dimensions for Blocking Sessions
If you want to build out and see what wait events are involved on the blocking session, this can be done as well. Just move the Dimensions bar below the load map from two dimensions to three. Then add another dimension to the load map.
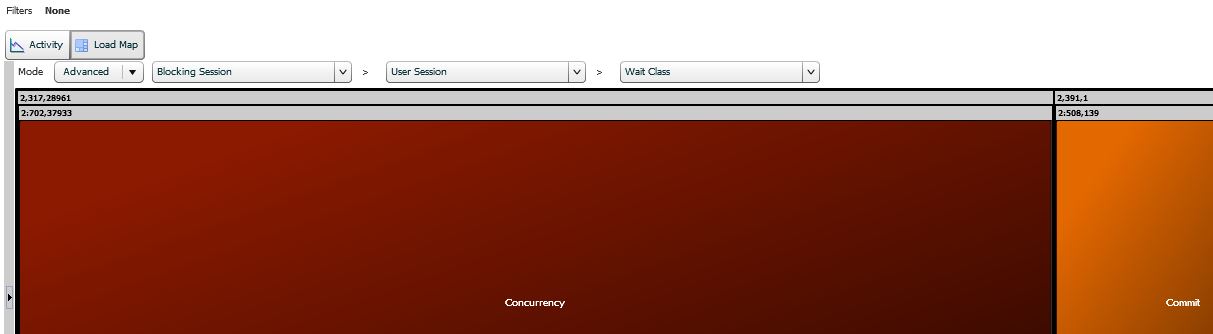
I now can see that I have a concurrency issue on one of the blocking sessions, (calling same objects) and the second blocking session is waiting on a commit.
The additional advantage of using this method to view blocking session data is that it’s not just “current blocking data” that is available as when you use the “Blocking Sessions” view in OEM.
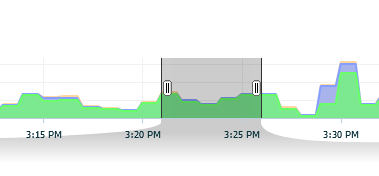
Using ASH Analytics allows you the added option to move the upper bar to display time in the past or move it to view newer data just refreshed.
If there is specific data that you are searching for, (username, SQL_ID, etc.) change the dimensions to display what you are interested in isolating. ASH Analytics supports a wide variety of data to answer questions about blocking sessions along with all other types of ASH data collected!
Why do yo need blooking_session_status=’VALID’?
In crisis moments I always do:
select sid, serial# from v$session where
sid in (
select blooking_session
from v$session);
And then
alter system kill ‘sid, serial#’ immediate;
I didn’t write this query, I’m showing you what is running BEHIND the SCENES by OEM… 🙂
The Blocking Sessions page has been around a long time and with it being there a long time, I’m pointing out- reviewing old code and other parts of an older feature are not a bad thing. In the meantime, if you want a GUI view of the data, here is another option.
Kellyn
Thank you very much for great explanation!
Thanks for sharing this Kellyn. I needed to troubleshoot a production blocking issue last night and remembered your mention of this at the IOUG meeting. Helped me tremendously! Thanks!