EM12c and the Optimizer Statistics Console
Today we’re going to review another great feature in the EM12c that you may not have realized was available. Once logged into a database target, click on the Performance menu and navigate to the Optimizer Statistics Console:

Optimizer Statistics Console Page
The new console page is clean, easy to navigate and has great access points to manage and monitor optimizer statistics for the given database target.
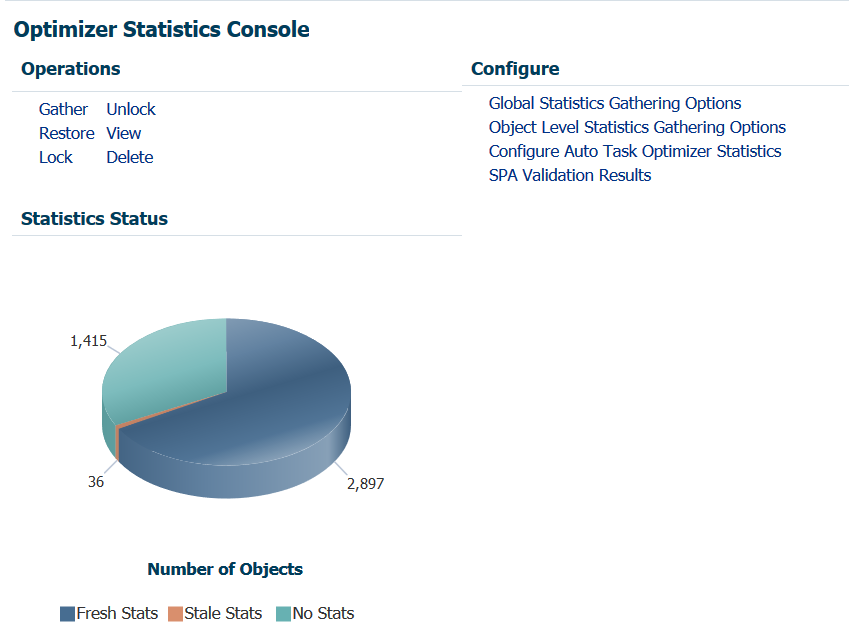
We’ll actually start at the bottom of the page with the Statistics Status and go up into the links. Viewing the graph, you get a quick and clear idea of the status of your statistics for the database target you are logged into. You can easily see if there are any stale stats that may be impacting performance and if there are any missing stats. You are shown how many objects are involved in the status category and can then move your way up into the links to review and manage your database statistics configuration.
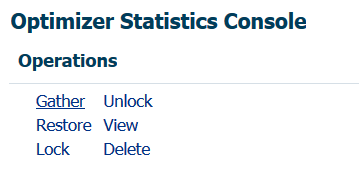
Operations
View
We’re going to go through the Operations by order of logic and not by order in the console, so we’ll start with View.
This link will take you to a great little report console that will display information about statistics in the database. Even though our example will display results for Stale statistics, note the other great filters for the report:
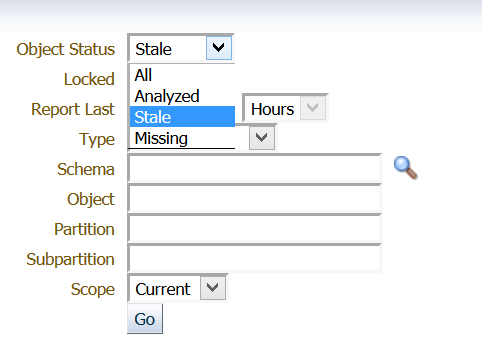
As we want to see everything, we’re not going to choose any other filters for our report until we get to the bottom and have the options of Current, Pending or All for our Scope We’re going to change it to All considering the version of database is 11.2.0.4 and we could have pending statistics waiting to be implemented.
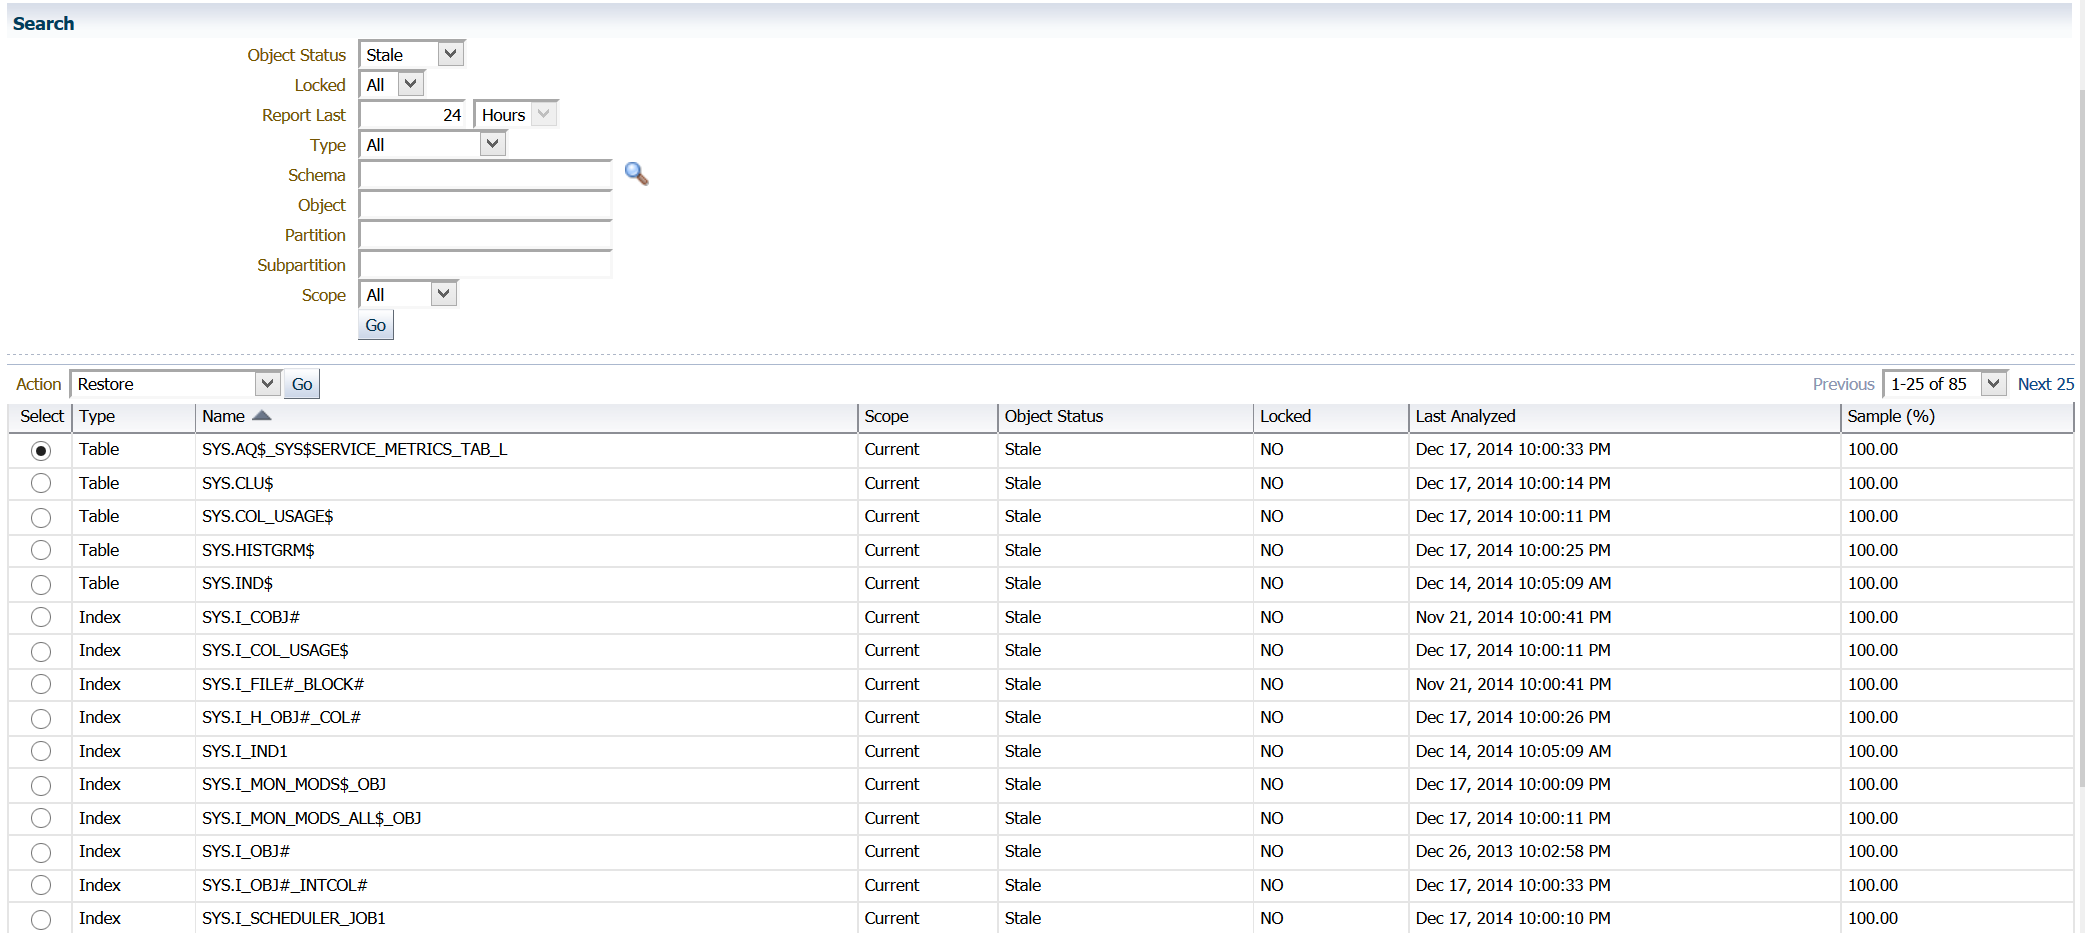
The report quickly showed that both data dictionary and fixed objects were stale, (schemas are up to date!) so we could multi-select objects on the left of the report and gather stats, (along with other options) or we could use the next section we’ll be covering to gather those stats in an EM job and address the stale statistics issue in what I feel, is a more user friendly interface.
Gather
Back in the Optimizer Statistics Console, we can click on the Gather link, you will be taken directly to the Gather Statistics Wizard:
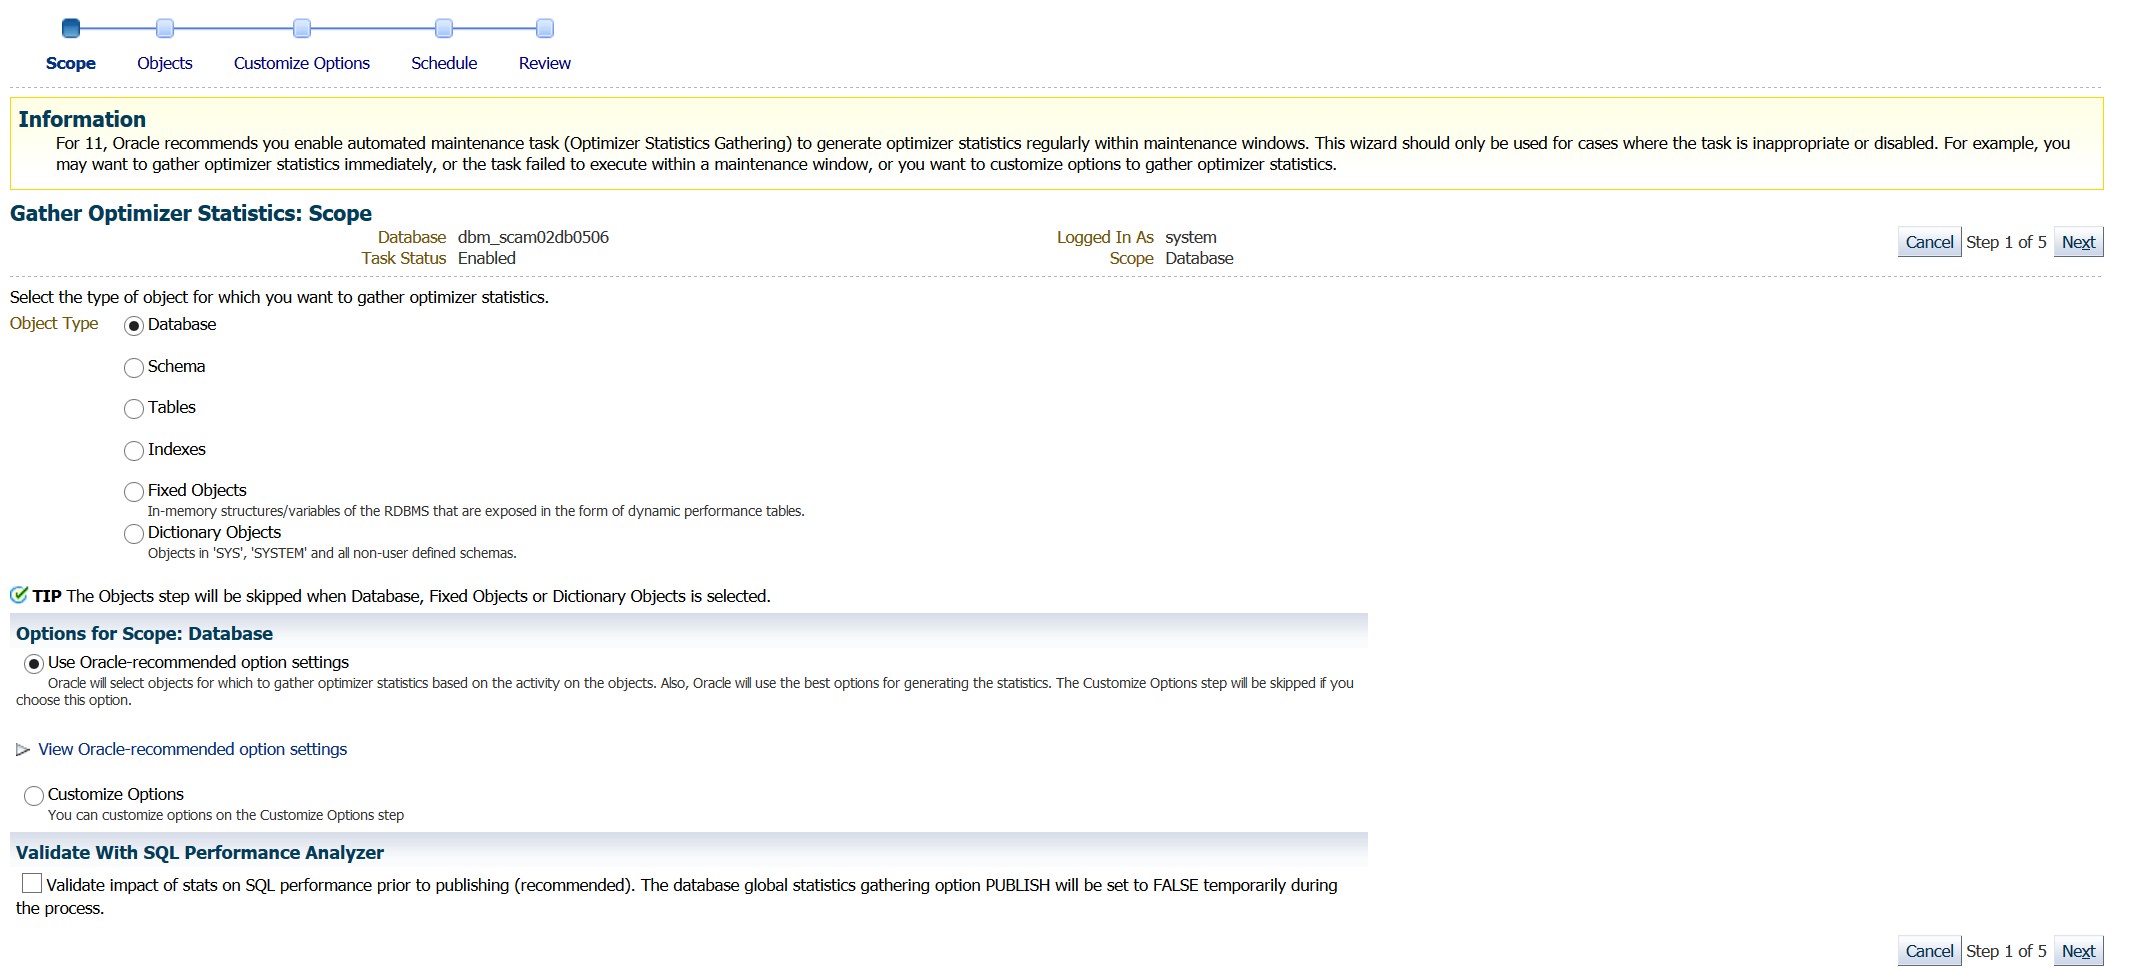
There is a clear warning at the top letting you know that as of DB11g, automated maintenance tasks should be enabled to gather nightly statistics. This is turned on by default in most databases, so this warning is a nice addition to this page for those that may not be aware.
Below this warning, you are able to choose what level of statistics gathering you wish to perform, (database, schema, objects, fixed objects or data dictionary…)
By default, Oracle’s guidelines for statistic collection options will be chosen, but you can change this to customize if you wish to work outside of Oracle’s recommendations. You can view the default values before deciding and if for some reason, you wish to use manual configuration options:

The wizard won’t ask you to set the manual configurations until later into the setup steps and if you change your mind, you can still choose the defaults.
At the bottom of the wizard, you also have the opportunity to use the Validate with the SQL Performance Analyzer, but as noted, the changes won’t be published and you’ll have to do that manually post the statistics collection run.
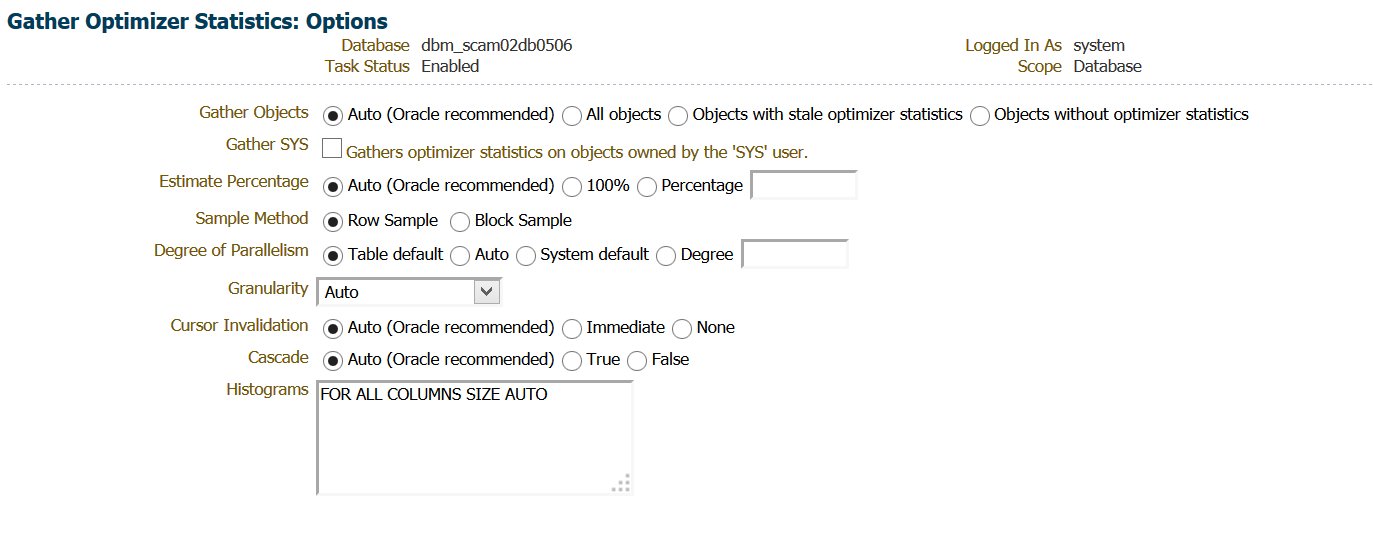
The next page will take you through the customizes options you want to use instead of GATHER AUTO, (although, like I said, you could just leave it as is and have it just perform the default anyway! :))
Then you get to schedule it via the EM Job Service and would monitor and manage this job via the EM12c Job Activity console.
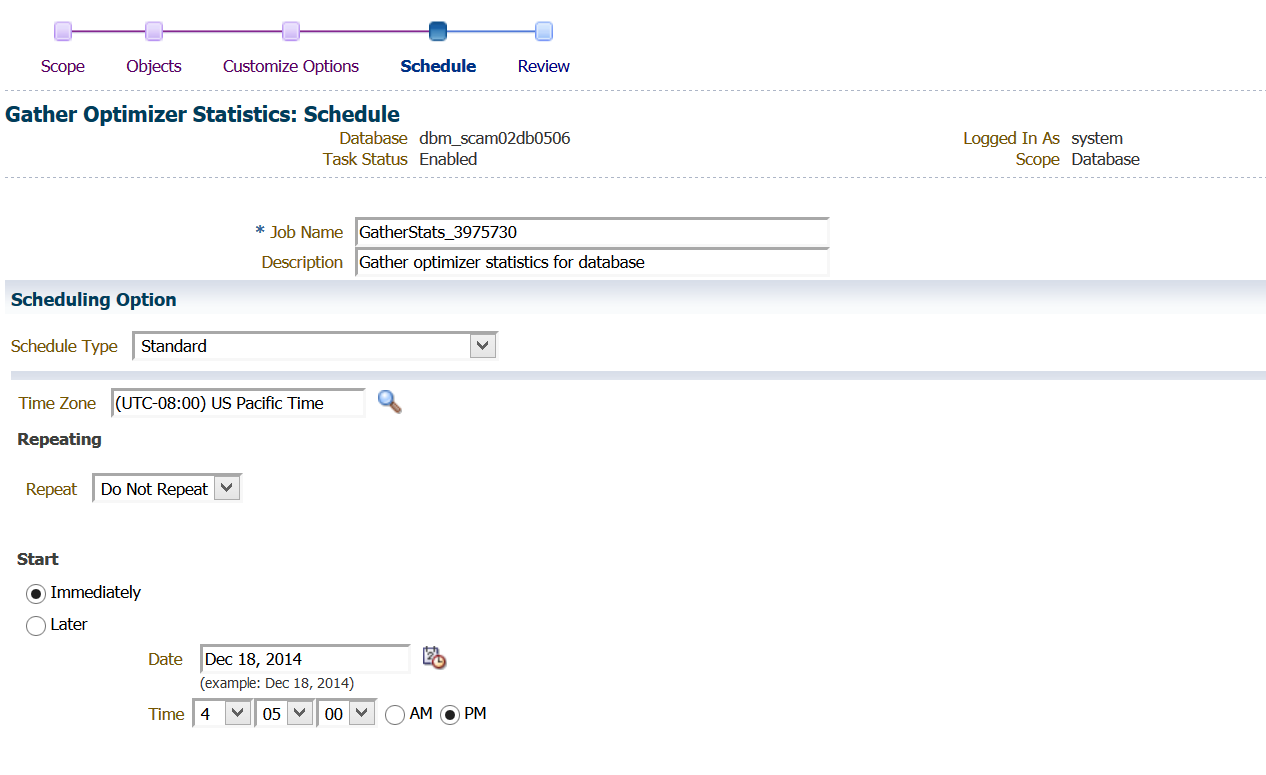
This means that this is not an automated maintenance task in the Database Job Scheduler and if you are not aware of how to view jobs via the DBMS_JOB_SCHEDULER, then you could have two stats jobs running for a database or even worse, simultaneously, so BE AWARE.
Lock/Unlock/Delete
As the Lock, Unlock and Delete links take you to similar wizards that do just the opposite action, we’ll group them together in one section. Using the Unlock statistics wizard in our example, you can click on the link and choose to unlock a schema or specific tables:
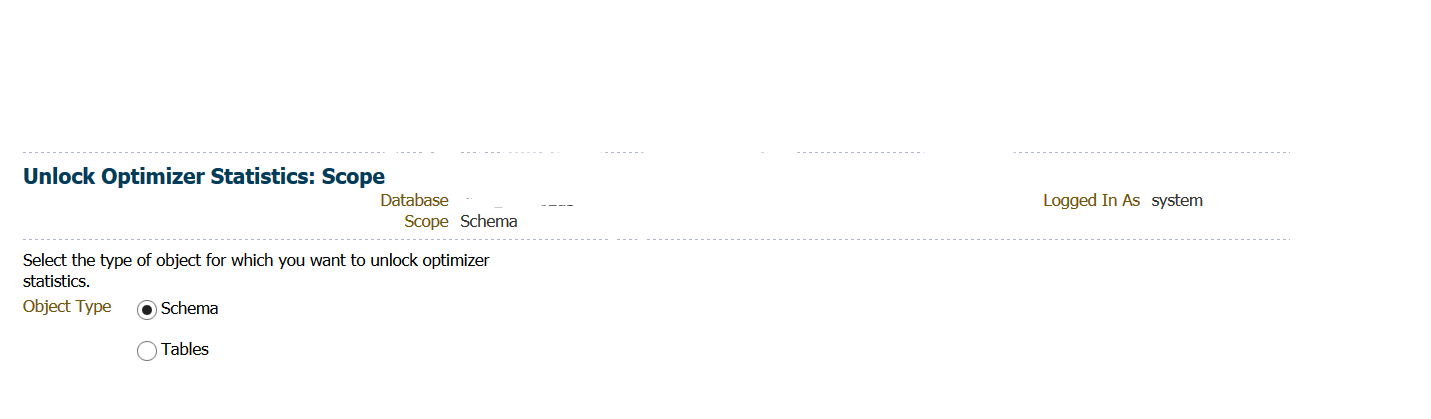
If you decide to unlock just a few or even just one object, the wizard makes it quite easy to search and choose:
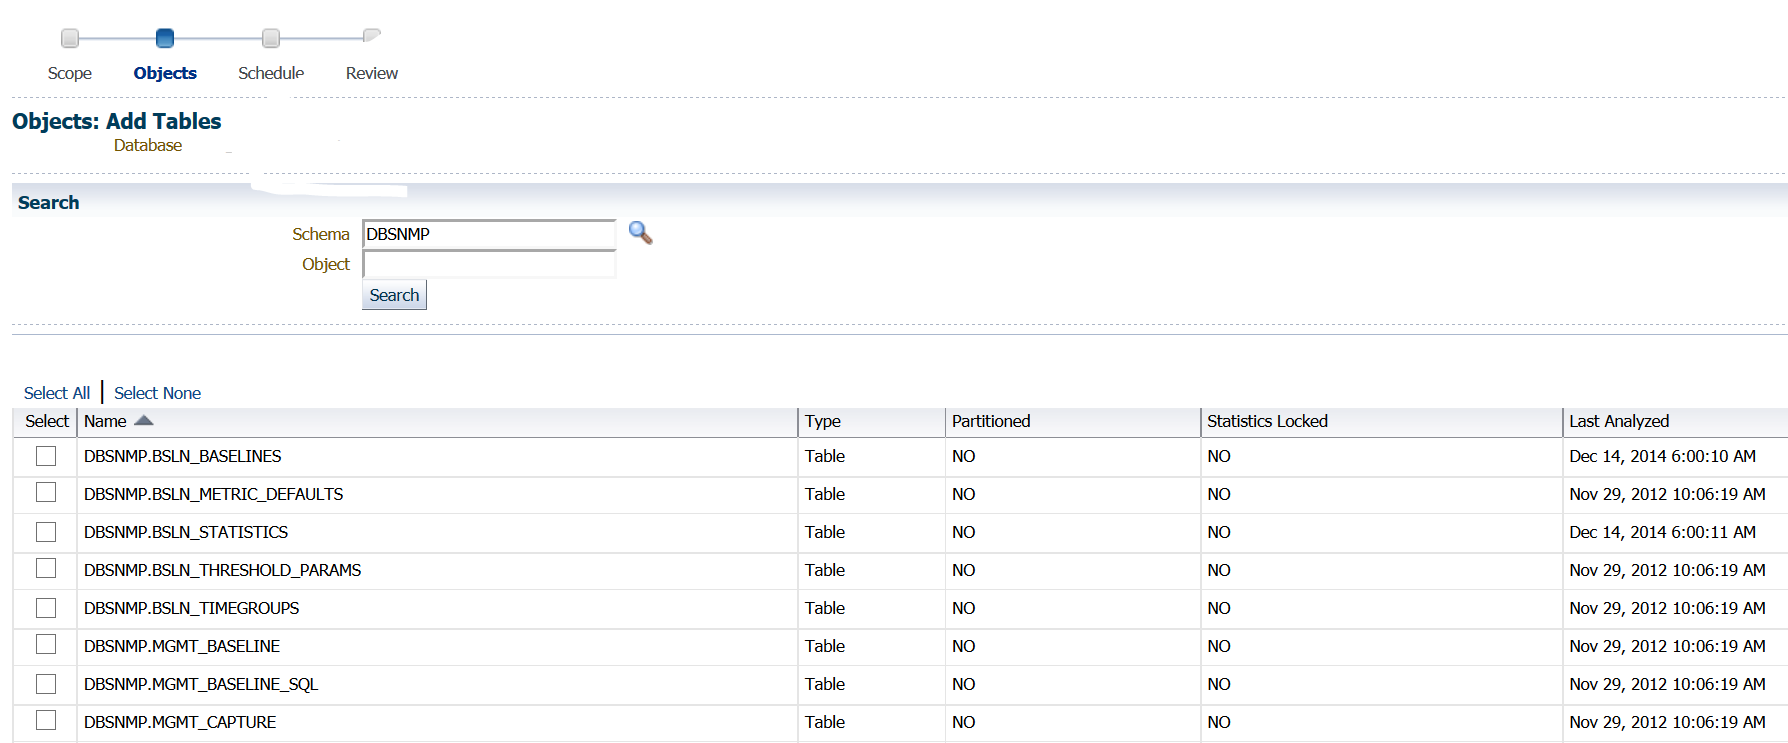
In the example above, I clicked on the magnifying glass next to the box for the Schema and then chose the DBSNMP schema. I can use a wild card search in the object name box or leave it blank and all tables in the schema are returned and a simple click in the box to the left of the object name will select it to lock, delete or unlock it, (depending which wizard you’ve chosen…) You also can view information on IF the object is locked or unlocked already, along with partitioning information, as you may have partitions that are locked while the table may not be.
Restore
The restore option is a great feature for those that may not be on top of their “restore statistics syntax on the top of their head” game. Now, I have to admit, some of the options in this wizard makes me very nervous. The idea that someone would dial back database level statistics vs. locating the one or two offenders that changed just seems like throwing the baby out with the bath water, but it is an option in the restore statistics command, so here it is in the wizard, as well.
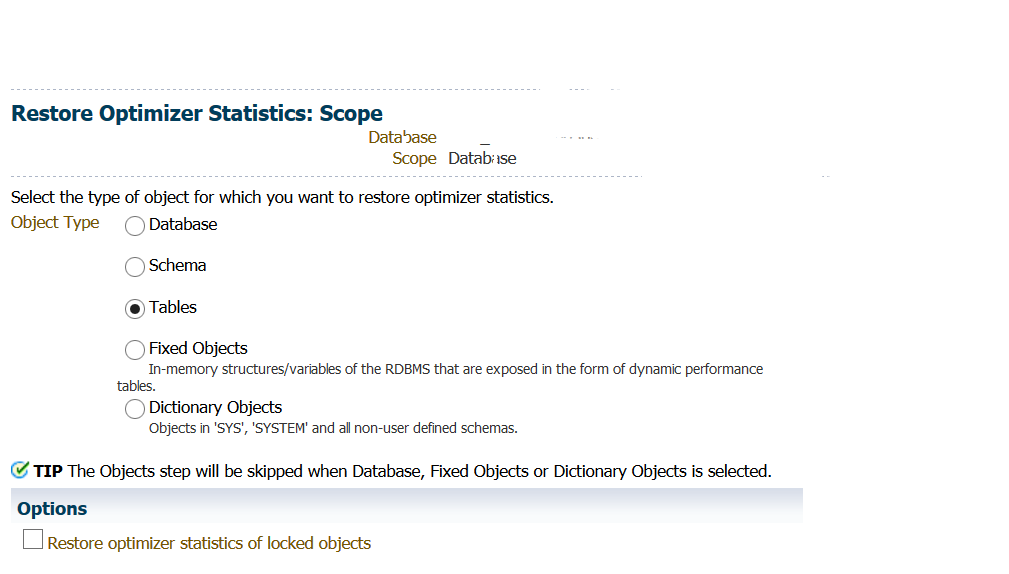
You have the option to override locked objects and force a restore, too. Like with locking and unlocking objects, the next screen in the wizard will allow you to choose a schema and object(s) that you wish to restore from and then once chosen, you will be asked when to restore to, including the earliest restore timestamp available:
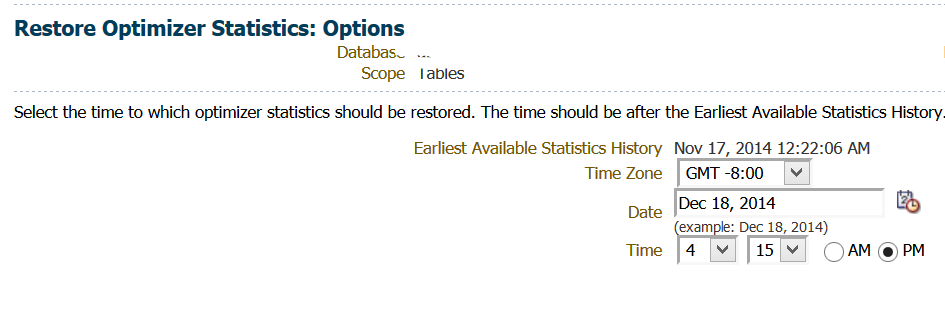
Post these choices, you then schedule the EM Job to run the task and you’re set.
Manage Optimizer Statistics
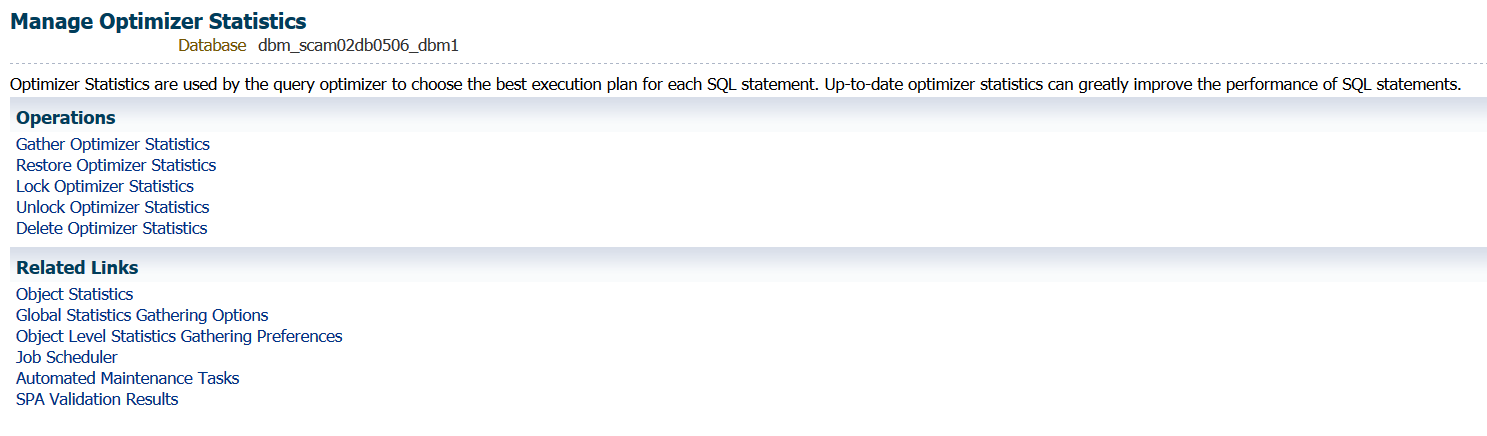
You must be granted the Create Job and Create Any Job privileges to take advantage of these features and will be warned if you haven’t been granted one or both.
Operations links include the ability to Gather Optimizer Statistics, which includes database and schema level, along with distinct object level. Secondary links to restore, lock, unlock and delete statistics for each statistics gathering type is available as well.
Related Links
The Related Links section includes links for research and configuration settings, such as current object statistics, global statistic gathering options, the job scheduler to view current intervals for jobs involving statistics as well as automated maintenance tasks which inform you of any clean up and maintenance jobs that are part of the overall Cost Based Optimizer world.
Configure
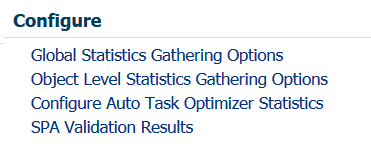
These links will configure the Automated Maintenance Tasks, allowing you to update schedules of execution, disable/enable and work with SPA results, (SQL Performance Analyzer.)
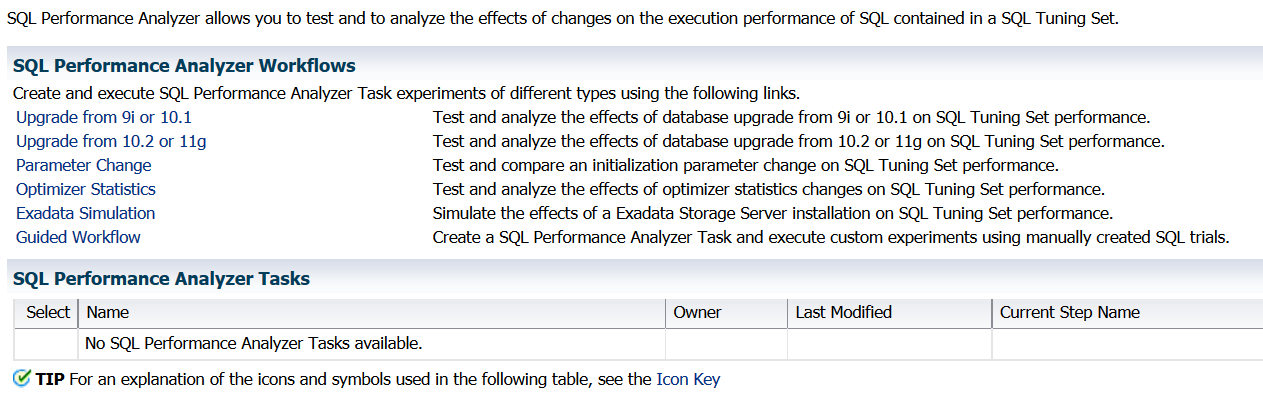
If you haven’t used SPA yet, it has some pretty cool features allowing you to simulate and analyze different performance changes before you make them. Nothing like being able to see in the future!
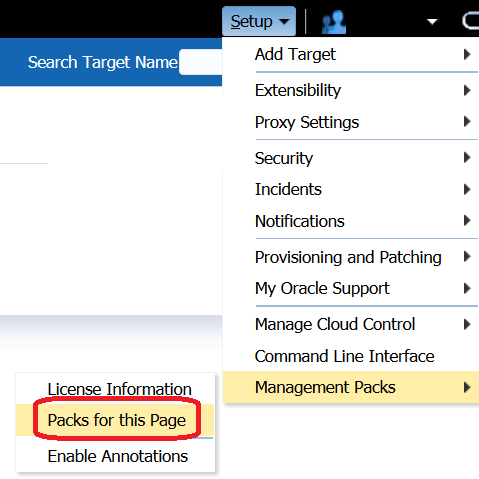
Working with some of these features may require a few management packs, (tuning, real application testing, etc.) but if you’re curious if you’re wandering into a new management pack land, it’s easy to locate from any EM12c console page:
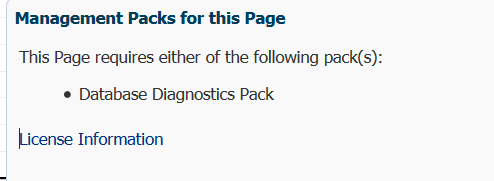
You will receive information about any management packs involved with the features you are using in the EM12c console for the page you’re on:
So embrace the power with optimizer statistics in EM12c Cloud Control and if you want to know more about managing Optimizer Statistics click here for the Oracle documentation or this whitepaper for more info.
Pingback: Log Buffer #402, A Carnival of the Vanities for DBAs | InsideMySQL