How to Use an ASH Report and Why
Active Session History, (ASH) reports are one of my favorite when investigating a performance issue. The biggest challenge I think that faces many administrators is to know when to turn to an ASH report and how to use the report to diagnose an issue.
Today’s example is brought to us thanks to a Workload replay that should be a simple, but also, a clear step by step of when and why to use an ASH report.
Top Activity
In our EM12c environment, we note some high activity in a database and use Top Activity to view what’s going on:
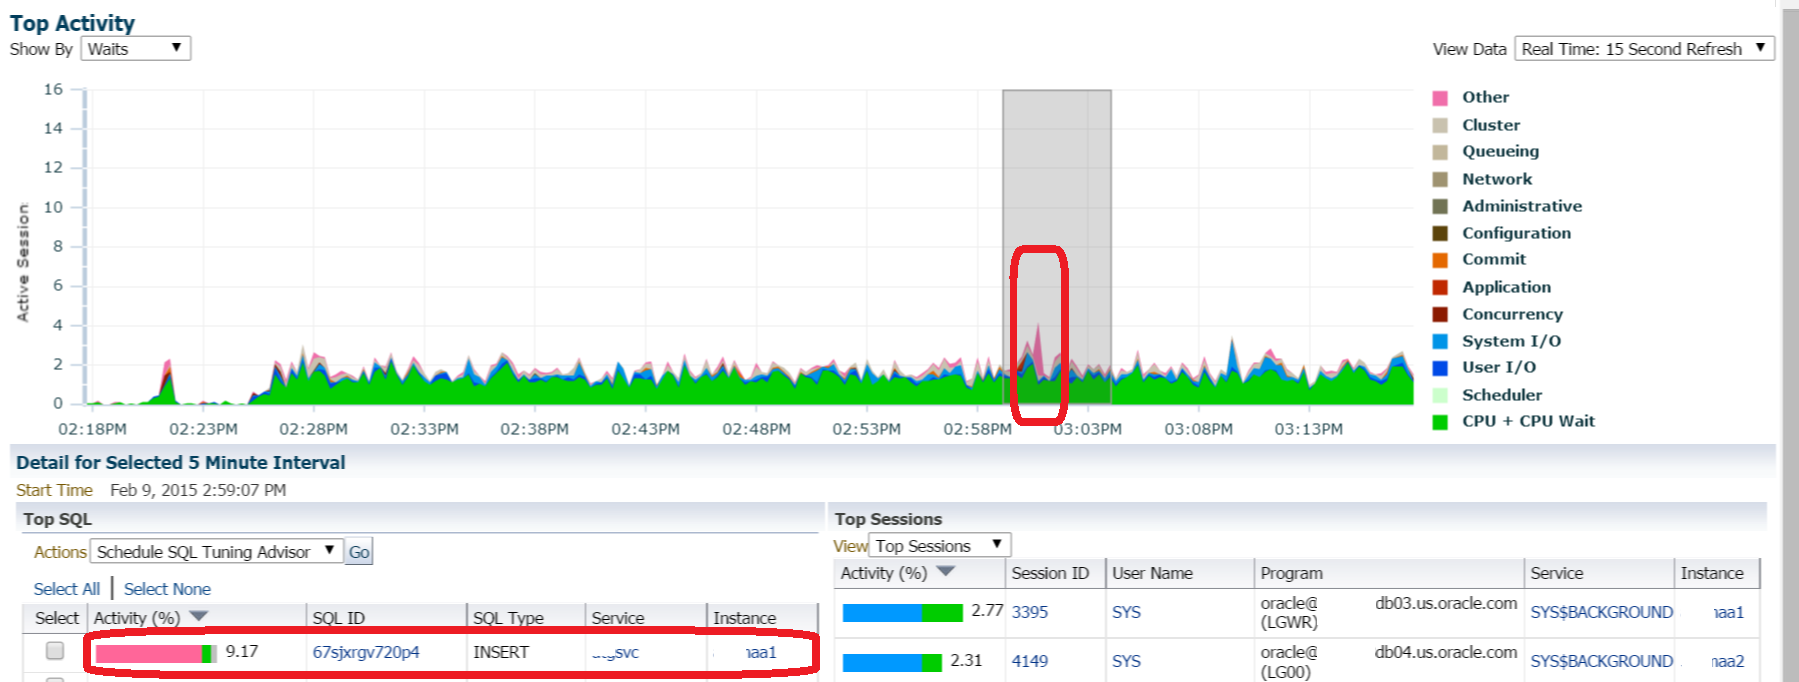
As a DBA, I’m not a fan of pink, red, brown or worse, black, in my Top Activity. I’m displaying the information from the Top SQL and Top Sessions from just before 3pm and we can see that “Other” was the wait event that is shown to be most impacting in our Top SQL.
SQL Details
We can then double click on the highlighted Top SQL session to dig down a bit more into that unique SQL_ID.
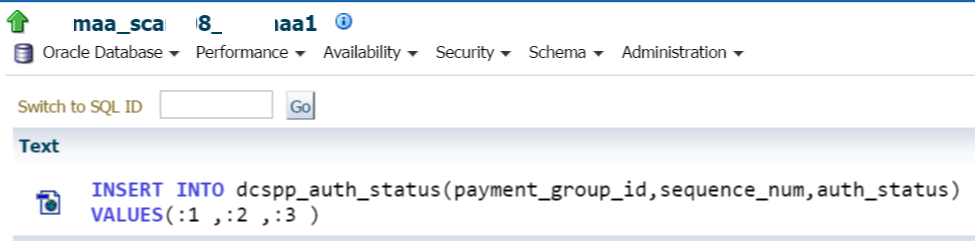
Noting that this is an insert statement, I can then scan lower to see more detailed information about the SQL statement, waits and sessions involved:

The top wait is Buffer Exterminate and this wait event might not be familiar to everyone, but we’re going to work through this post to investigate the information provided from the ASH report to experience the type of impact this wait event has on the database.
Report Options
You’ll notice that the SQL Details page offers you two reports that you can run- AWR SQL Report and the ASH Report. These reports can both be found in the $ORACLE_HOME/rdbms/admin directory.
AWR SQL_ID specific report is named awrsqrpt.sql and the ASH report is named ashrpt.sql if you’re interested in running them from the command line via SQLPlus instead of using EM12c.
We are going to choose to use the ASH report instead of the SQL_ID specific AWR report OR a full AWR report for a couple reasons:
- We are only interested in this specific SQL_ID, so the full AWR report would be overkill.
- The specific AWR SQL_ID report wouldn’t include the session, blocked session and other wait info we are interested in.
- We aren’t interested in execution plans, which the SQL_ID specific AWR Report includes.
- The ASH report allows us to use samples and drill down to by time vs. snapshots, which comes in handy when we are inspecting particular set of transactions. We aren’t concerned with number of executions, which is offered in AWR, but not in samples with ASH.
Running an ASH Report
Running an ASH report after clicking on the button is quite easy. Not only is the time pre-filled-
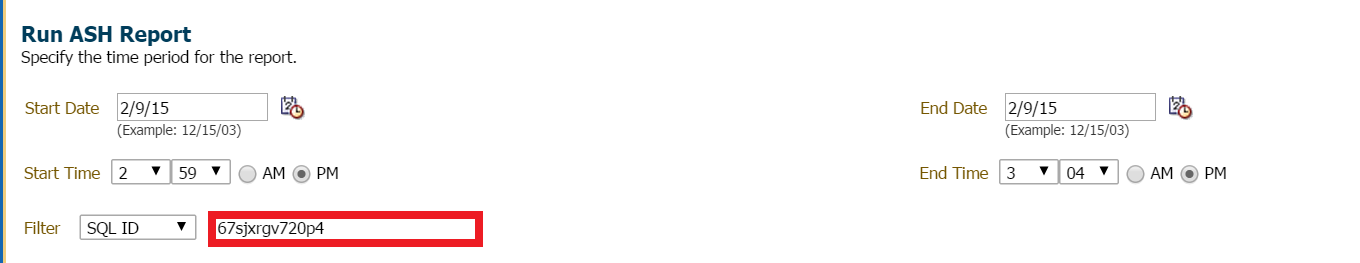
we also have the SQL_ID filter to give us more accurate information about this one SQL_ID. You can change the window for the beginning and end time if you’d like to extend it, but know that ASH is much more effective for smaller snapshots of time.
Once satisfied with the criteria for the report, click on Run Report and the HTML version of an ASH Report will display in short order.
The Actual Report via Cloud Control
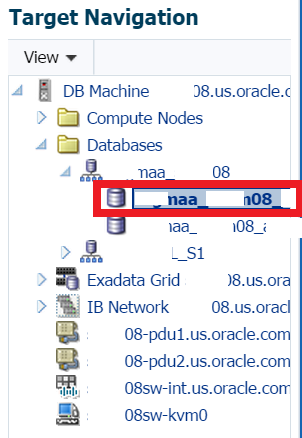
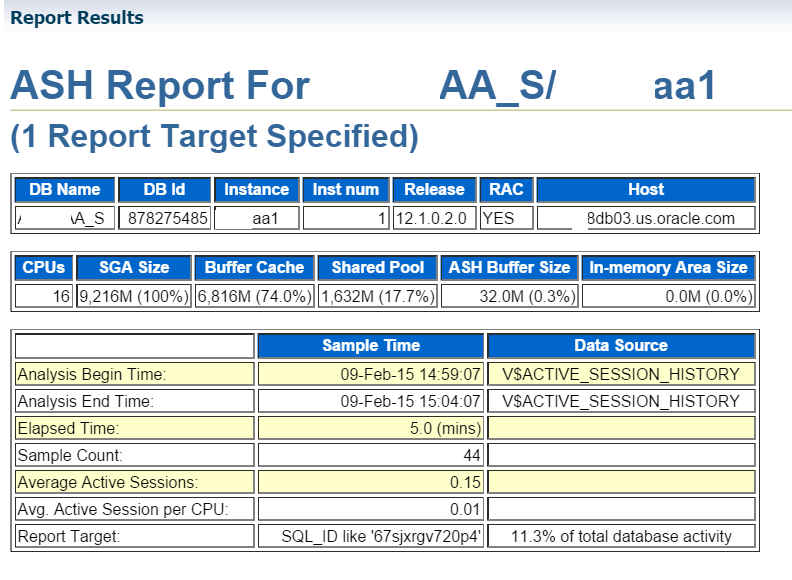
The first thing to remember is that the report is generated by database node if you are in a RAC environment. The left hand Target Navigation will show you what target node the report has been sourced from:
The report starts out with basic information about the environment the report was run in:
The first section we jump to, which we almost always jump to, is the top wait events:
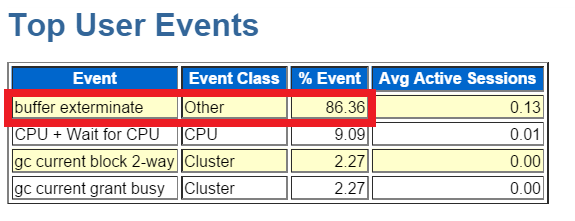
I find it difficult to spend much time on anything that comes up under 10%, (at least its a pretty good rule of thumb to follow…) but as you can see, we are showing over 86% of the event waits on buffer exterminate.
If we go down to the second section we go to most often, the top SQL, we’ll see more verification of this issue:

For SQL_ID 67sjxrgv720p4, we can see that over 86% is spent on the wait event buffer exterminate.
We can also view the sessions involved with this SQL_ID and if there were any Blocked Sessions, that is listed in its own section. No blocked sessions here, so we can go onto more important research.
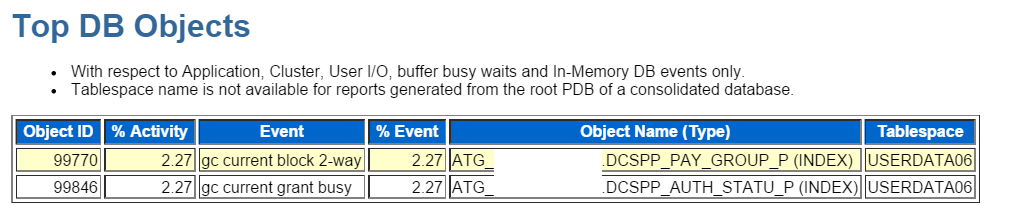
Objects are most impacted by the waits for this statement are also displayed and if this had been part of a stored procedure of other internally stored code, this would have been shown, again, in it’s own section.
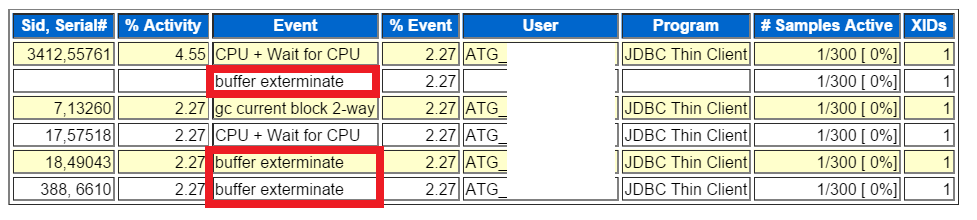
At the bottom of the report, we see what top waits happened in succession during the time we chose to examine the ASH samples:
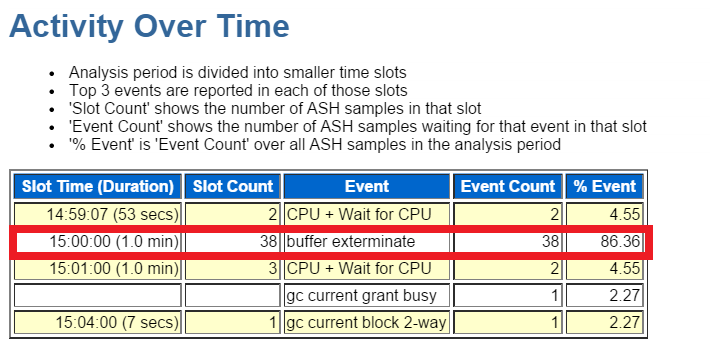
As you can see, the samples are all about one minute each of an approximate five minute examination of the ASH sample time. We can see at the 3pm time, (just as was displayed in the Top Activity) the impact of the buffer exterminate wait, then the wait for CPU and cluster GC waits post the “hit”.
Buffer Exterminate Waits
So what is Buffer Exterminate? A lot of folks like to refer to this as “SGA Thrashing”- sounds lovely, doesn’t it? The wait event happens when a database uses Automatic Memory Management, (AMM) and the MMON background process decides to shrink the buffer cache and reallocate the memory to other areas of the SGA after advice from the memory advisors. A lot of DBAs haven’t been sold on AMM yet and I have to admit, I’m one of them. I only use it in small, non-important databases and often avoid setting it for any OLTP environment. One thing to keep in mind though, I’m more often in the EM12c world these days vs. working with memory allocation issues in DB12c, so I don’t have the experience in DB12c and multi-tenant to give an educated review of AMM with the new version.. 🙂
The above ASH Report should be enough to let you know that this database is impacted by current AMM settings during resize, but if you need to provide more information, you can do this in two ways:
- Review the Memory Advisors in EM12c.
- Query the V$SGA_RESIZE_OPS and V$MEMORY_RESIZE_OPS directly to see how often the resize is happening.
Here’s a simple query to start:
SELECT parameter, initial_size, target_size, start_time
FROM v$memory_resize_ops
WHERE initial_size > = 0
and final_size > = 0
ORDER BY parameter, start_time;
Another choice is to set DB_CACHE_ADVICE to off and then set the db_cache_size directly.
And that concludes an example of how and why you would use an ASH report to investigate an issue in Oracle. Have a great day and as always, do everything you can to be bulletproof!
Pingback: Re-Adding a Database to the AWR Warehouse Without Losing Historical Snapshots - Oracle - Oracle - Toad World