Recommendations to Address Cloud Performance Issues via EM12c
So I’m going to start this post with an admission- I don’t have access to a cloud environment to test this out, but I know what I would do first if I experienced slow response time on database creation or cloning via EM12c to the cloud and I would like to at LEAST post what I would do to give others the chance to test it out and see if it offers them some help.
Knowing what is causing slow performance is essential to trouble shooting any problem. I’ve had a few folks come to me with complaints that their hybrid cloud clones or database creations in the cloud are slow, but with the little data I’ve seen in the exchanges, its starting to give telltale signs that the cloud isn’t the issue. There are some Enterprise Manager features with 12.1.0.5 that may be able to assist and that’s what we’ll discuss today.
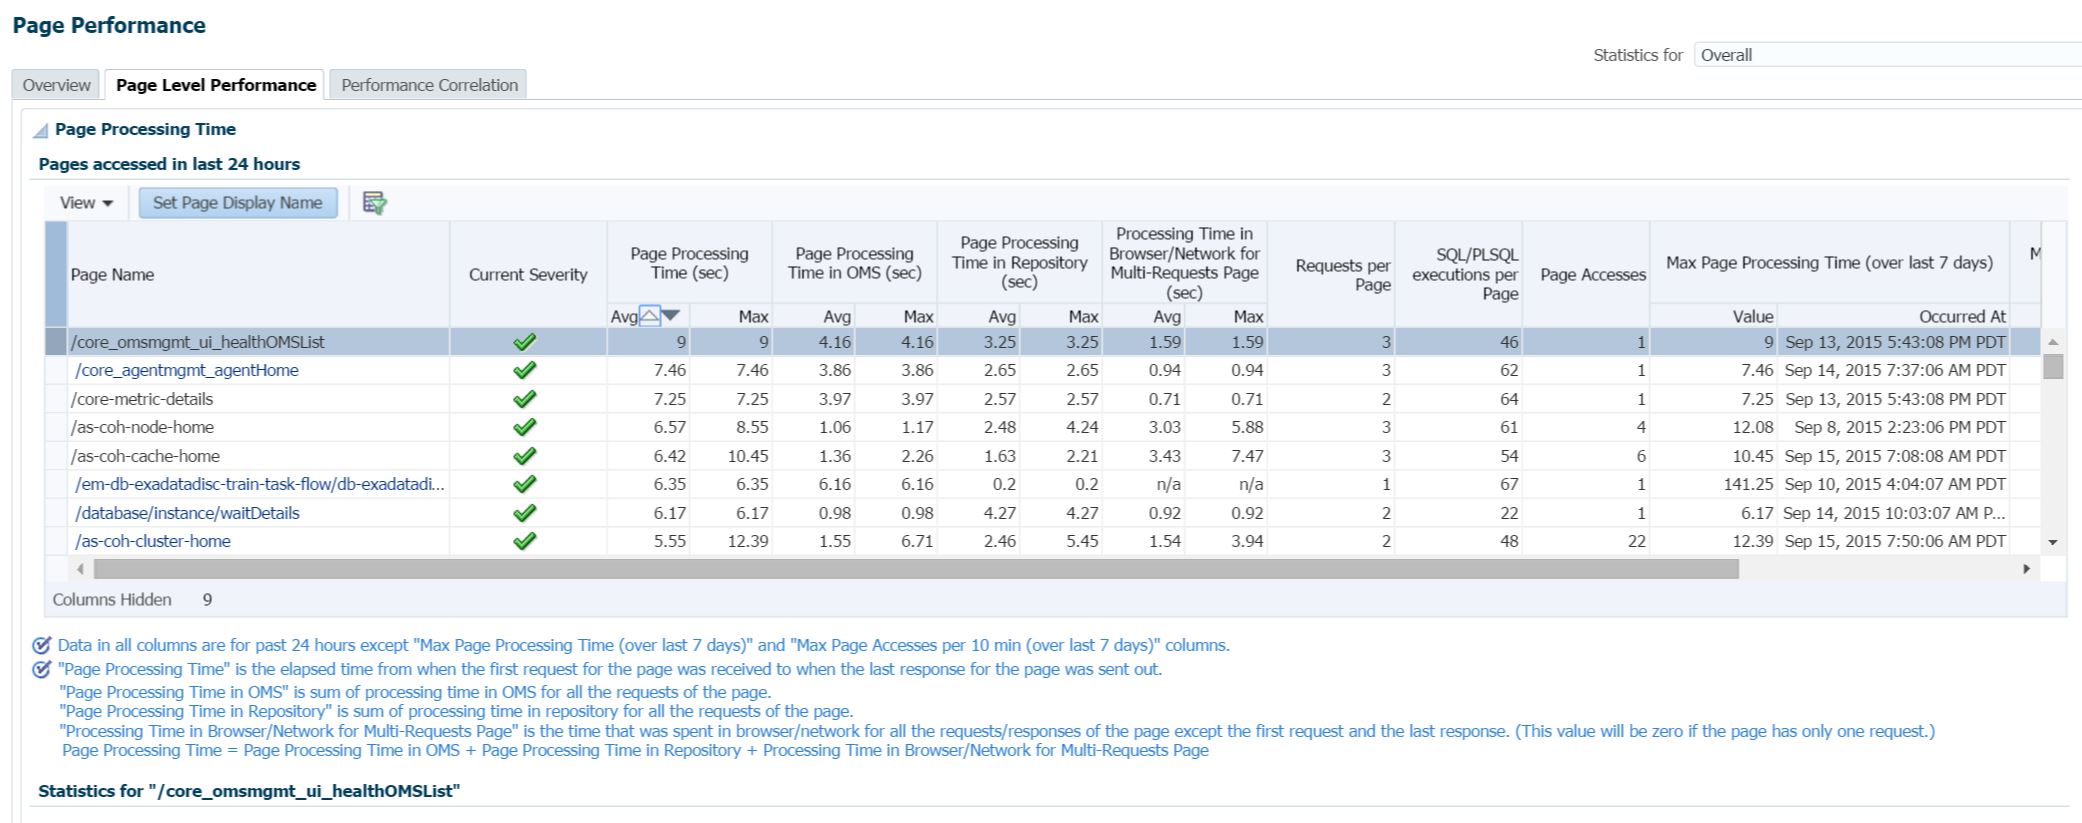
Page Performance
Although log data and diagnostic utilities are crucial when I’m trouble shooting anything, simple visuals based on this data can be very helpful. The Page Performance for the Repository is one of those features, but there is one caveat- the page that is experiencing slow performance, (i.e. database creation wizard with Cloud Control to the PaaS in the cloud, etc.) must be run at least two times in the last 24 hrs to be captured in this tool.
The data provided by this tool is based off a considerable amount that we collect via the EM Diagnostics utilities, so although it doesn’t provide as deep a diagnostic as the utility does, it may shed some high level light on what you’re facing.
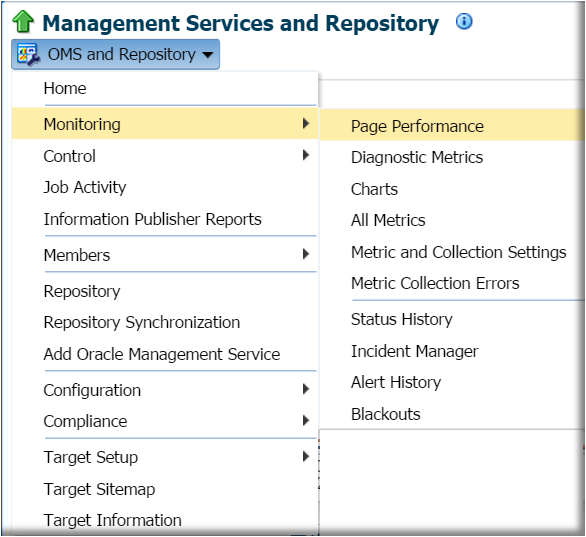
To access the page, you need to be in the OMR, (Repository) target, which commonly is accessed via Setup, Manage Cloud Control, Repository and then from there, click on OMS and Repository, Monitoring, Page Performance. You’ll see the second tab in is Page Level Performance, which will have the data that we’re about to go deeper into today.
Upon accessing the dashboard, you’ll quickly notice that many pages have very different requirements to produce the output that you view in the console pages, (i.e. not all plugins and collections are created the same… :))
Now I want you to focus on the headers to note the data collected:
Cloud Control breaks down the page processing time for a number of different areas-
- Total Page Processing Time in Seconds
- Page Processing Time in the OMS, (Oracle Management Service)
- Page Processing Time in the OMR, (Oracle Management Repository)
- Processing Time in Browser/Network, Multi- Requests Page
- Requests per Page, (very good when it comes to efficiency)
- Number of SQL/PLSQL Executions per Page
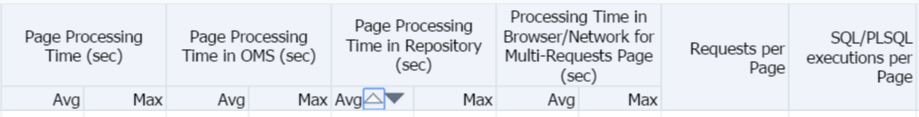
The one I’m going to focus on is the Processing Time in Browser or Network. If you note, there are sort options for each of the Avg and Max totals that are collected in each column.
If we sort by Max Processing Time in Browser/Network and we’ll choose the first in the list that contains an active report, (the others are stale, so those pages aren’t links you can click on…):
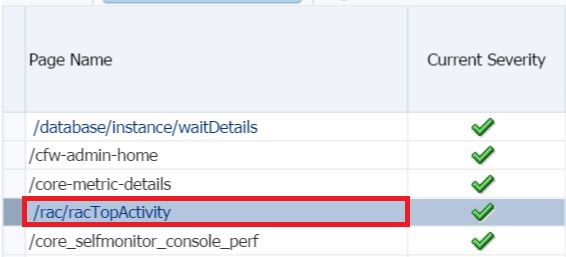
Again, I don’t have any cloud access to demonstrate this on and as you can see, the RAC Top Activity is what we’ll use for this example of how we can inspect wait information on page response.
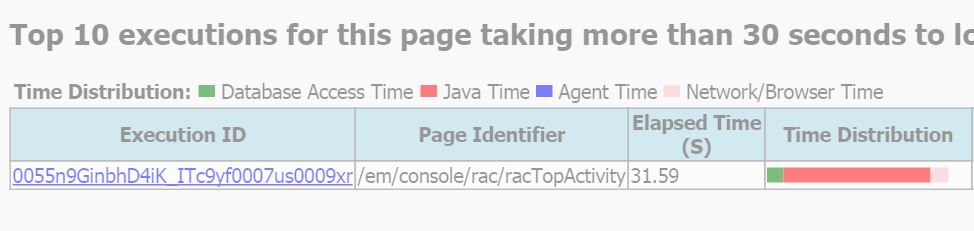

The top of the page clearly shows what IS the time distribution across Database, Java, Agent and Network/Browser. You can in the lower section, (actually to the far right in the console) the amount of seconds allocated to each type of task by the process, which for our example is considerably Java Time. If there is SQL involved, it also breaks down the execution plans and wait events.
For this example, there is a small amount of network time, (this is the “High Availability” environment at my work, so it’s a pretty buff setup) but it does display the light pink section that shows there are some waits for the network and/or browser.
If WE WERE inspecting a cloud usage process, we should see what is the time distribution for the network and I’m pretty sure we would see that displayed in these pages clearly, (again, this is an assumption on my part, as I haven’t had the first hand experience to investigate it…)
Summary
If you are working in the Oracle cloud and are experiencing slowness, run the cloud process via the console a couple times, (even if it does timeout) and consider using the Page Performance feature to make a quick inspection of the report. Although the example above clearly shows how much time is being spent on Java, you may find for the cloud, you’re dealing with network slowness that requires some investigation into firewall, DNS resolution and other challenges, but this report may quickly show the Oracle cloud as the innocent party.