Data Modeling, Dates and DAX
Presenting data in the format to ease visualization is required for any BI product. Power BI provides much of this with Data Analysis Expressions, (DAX). As a DBA, I admit to cringing every time a reference was made how similar it is to functions in Excel or other non-database platforms. I’m a DBA and I naturally am going to see data at a much larger, more complex level. I love the simplicity of DAX, which granted me the ability to acquire basic skills using it in just a day, but considering Power BI’s ability to pull from multiple data sources, including SQL Server, Oracle, PostgreSQL and even JSON files, the comparison to Excel left me feeling, well, ‘meh.’ 🙂
Now I learn in a crazy, drink from the firehose, throw it all at me and in four-six months it will all come together into beautiful order. So let’s start with a few basics so the rest of you don’t have the mish-mash that’s in my head.
A query is an object, (table) in Power BI. In a query, a set of columns are created from a data set you load from an external data source. As data is most efficient in the format to be presented, we have two ways you’ll most likely massage data post the source load:
Columns and Calculated Tables:
- For every row from the original query, are immediately calculated upon “Enter” in the formula section and become a new column in an existing table or a new table.
- Preferred for advanced features like Slicers, hierarchy, etc.
- These are physical objects, so they consume storage and will add to the size of your PBIX, (Power BI) file.
A Measure is:
- Evaluated as soon as you add or render it into a visual/dashboard.
- It’s similar to a database view- so it’s part of the report, but it’s not a physical object to take added storage. It will need to be calculated each time it is rendered.
- Excellent choice for aggregation, but just as with a database view, consider the complexity/data load for resulting performance impact.

When working with dates, the data modeler is going to use DAX on a regular basis as part of columns, new tables and in measures to provide value in a report or visual. These expressions include functions, (and you’ll here me use the term expressions and functions, so hopefully I won’t incorrectly use the terms as everything sorts out in my brain) that simplify the calculations behind comparisons, accumulations and distribution of time. Calculating by how many days, weeks and even years to group data by will often be a requirement. To do this, we need to be able to perform complex math against dates and with Power BI, functions serve this purpose, just as it does in other consumers of data.
I quickly got over my initial ‘meh’ about how most sales folks would describe Power BI to business folks; heck, it’s not me they need to sell it to- I’m already sold. I have to admit, DAX date functions provide the power needed to build out the visualizations with data without having to write complex SQL or valuable resource sucking SQL or possible nested views which we DBAs hate. Its worth the time for DBAs who work with Power BI to embrace DAX, just as many in the Data Platform already community have.
I’m going to use a simple data load pulled into Power BI, focusing on a dimensional date table:
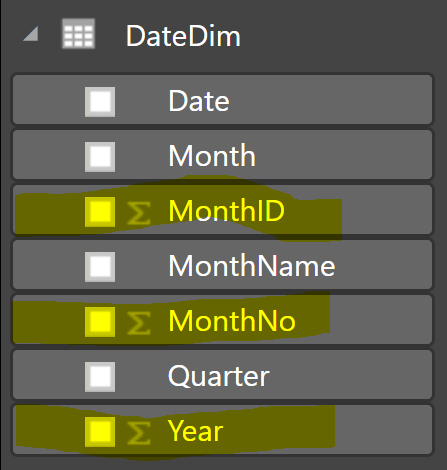
The columns highlighted in yellow show as “summed” but think of the data “aggregation” to simplify selectivity in SQL:
SELECT * from DateDim
WHERE YEAR in (2000,2001)
GROUPBY YEAR;
Selecting wouldn’t require a to_date function or a function index in the Oracle world. The data set is already presented as a column to simplify visualizations. The Power BI data modeler can utilize this, along with the other columns highlighted to add more value to the data results.
Now I’m not happy with some of the data that came over from my source. It met the requirements for the database, but not for Power BI. I’ve removed and even recreated a number of columns, building out my own to fulfill the requirements for my visualizations.
There are numerous built in functions for dates that can then be used for those columns or measures or even new tables. DAX looks the same, the item created is all that’s different: physically stored, (column or table) or calculated on each rendering, (measure). Examples of this, using our DateDim table would look like the following:
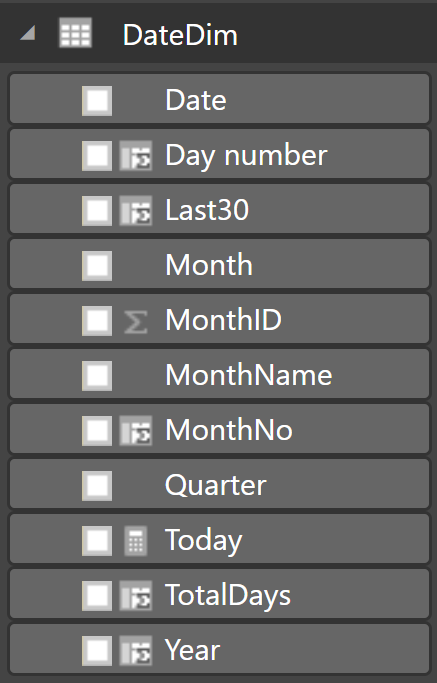
I start by adding the following columns:
The Year: Year = YEAR(DateDim[Date])

The Day Number: DayNo = DAY(DateDim[Date])

The Month Number: MonthNo = MONTH(DateDim[Date])

The Day in the year to be used in calculations: TotalDays = DAY(Date(DateDim[Year],DateDim[MonthNo]+1,1)-1)
I then created a new MEASURE:
Today = Date(YEAR(NOW()),MONTH(NOW()),DAY(NOW()))
And then two more columns that will depend on the Today measure:
Last30  = IF(AND(DateDim[Date]>=[Today]-30,Date[Date]<=[Today]),1,0)

Last60 = IF(AND(DateDim[Date]>=[Today]-60,Date[Date]<=[Today]-30),1,0)
The functions, as well as calls to created columns or measures are in bold, simplifying and reusing common calculations.
My original DateDim table is different now to support the needs of the visualization requirements.
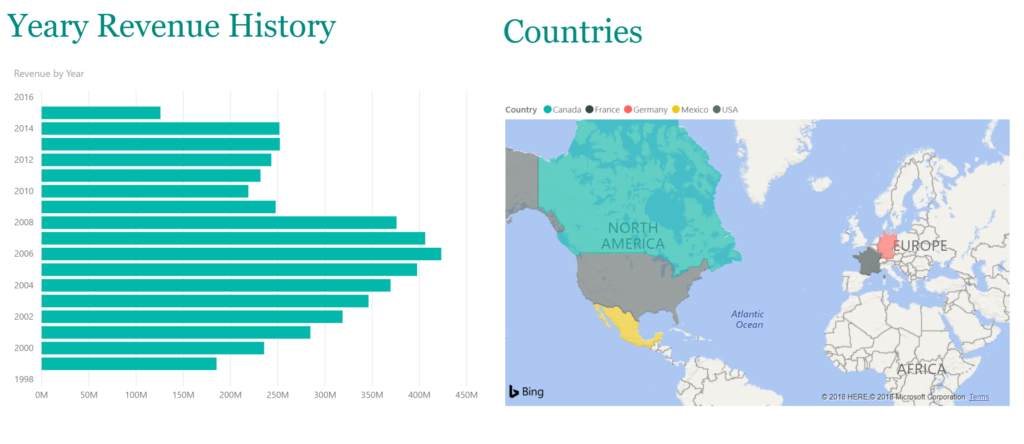
Pretty straight forward and its something we see, no matter if we use SQL, Java, Python or R. Functions make the world go ’round. By building out the basic building blocks and then using them to build out more complex ones, like you see TotalDays, which uses both the Year and the MonthNo that we created, then we’re able to create something like the following, which gives us revenue by regions for the last month that you can drill down into.