
So what do you do when network hiccups and other “small” issues start to send you incident notifications that a target is down, when in fact, it was really about a target just being delayed in communicating with the Oracle Management Server, (OMS)?
These are just one more way that “white noise” can drive a DBA to pull their hair out.
This post will discuss ways you can eliminate this type of EM12c “white noise”.
Let’s say we are receiving this incident notification, almost every night. We’ve done some research and discovered that heavy network traffic at this time is causing just enough delay in the connection to cause an availability incident notification to be sent. Our goal is to have the notifications stopped, as the network traffic is outside our control
Host=hostxyz@domain.com
Target type=Oracle Authorization Policy Manager
Target name=/EMGC_GCDomain/GCDomain/EMGC_OMS1/oracle.security.apm(11.1.1.3.0)
Categories=Availability
Message=The J2EE Application is down
Severity=Fatal
Event reported time=Dec 6, 2013 12:10:54 AM CST
Operating System=Linux
Platform=x86_64
Associated Incident Id=51782
Associated Incident Status=New
Associated Incident Owner=SYSMAN
Associated Incident Acknowledged By Owner=No
Associated Incident Priority=Very High
Associated Incident Escalation Level=0
Event Type=Target Availability
Event name=Status
Availability status=Down
Rule Name=Incident Management Ruleset,Incident creation Rule for target down.
Rule Owner=SYSMAN
Update Details:
The J2EE Application is down
Incident created by rule (Name = Incident Management Ruleset, Incident creation Rule for target down.; Owner = SYSMAN).
What we want, is to dial the “sensitivity” down a bit and for EM12c to double check before it alerts. To do so, we are going to click on the link:
Target name=/EMGC_GCDomain/GCDomain/EMGC_OMS1/oracle.security.apm(11.1.1.3.0)
This link will take you to the “oracle.security.apm
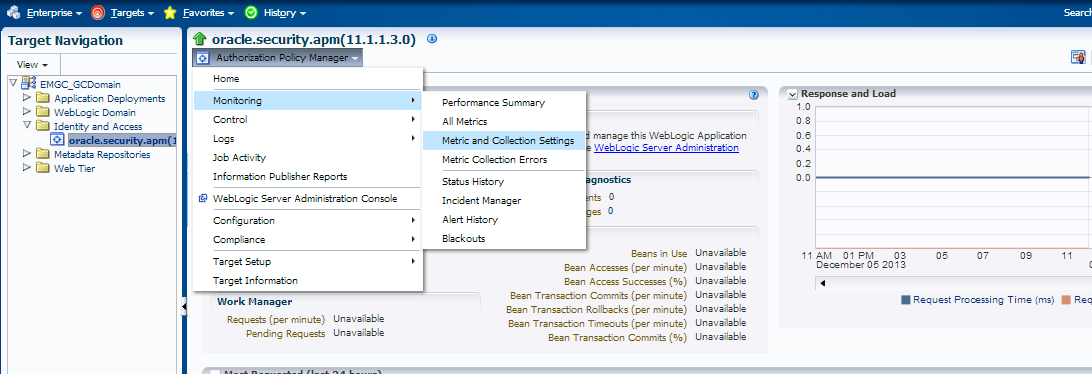
On this page, click on the Drop down below the description of the feature, (in this case, it’s the Authorization Policy Manager) click on “Monitoring” and then “Metric and Collection Settings”.
This will take you to the specific metric settings for this feature that are triggering the incident-
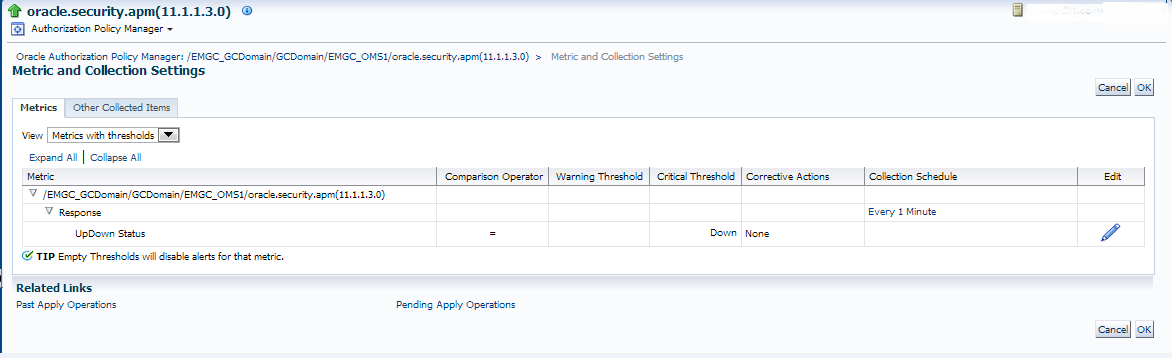
There are two areas we are going to edit- The first, is accessible by clicking on the “pencil” icon to the very right.
This will take you to the following page:
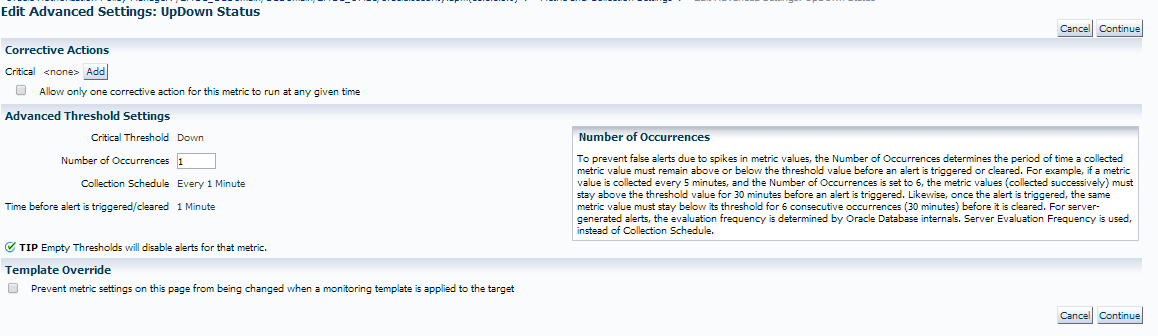 Notice that we are alerting on the following:
1. If the target shows that it is down.
2. It occurs once
3. We check this every 1 minute.
We are going to make the following change:
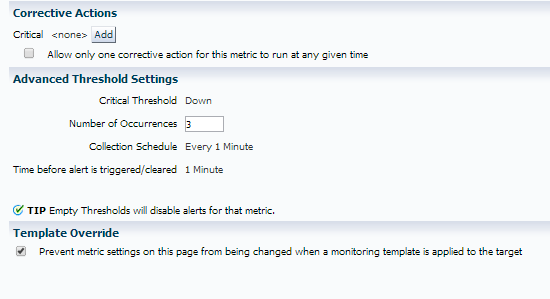
Now we are only going to create an incident and alert if it’s occurred three times in a row and as we don’t want our global monitoring templates over-riding it for this particular target, we have check marked the box at the bottom for the template override option.
Choose to save and you will return to the previous window.
Now click on the “Every 1 Minute” link, which will take you to the interval settings for this metric:
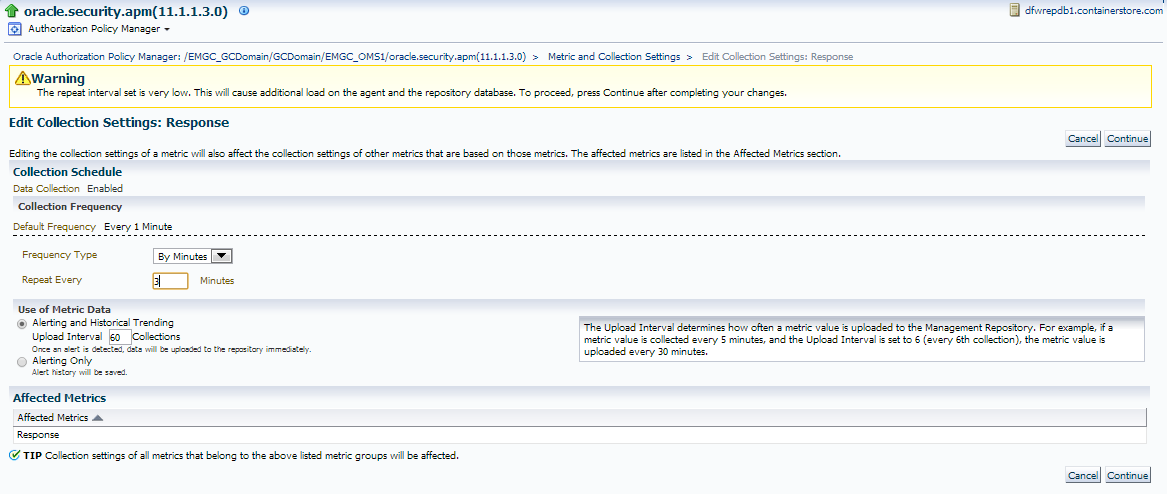
The interval’s default setting let’s me know that the repeat interval is set quite low and is causing extra load. A change to ever 3 minutes, upon applying, shows it’s still quite low, so for this server, I’ve decided, I’m going to move it to every 5 minutes:
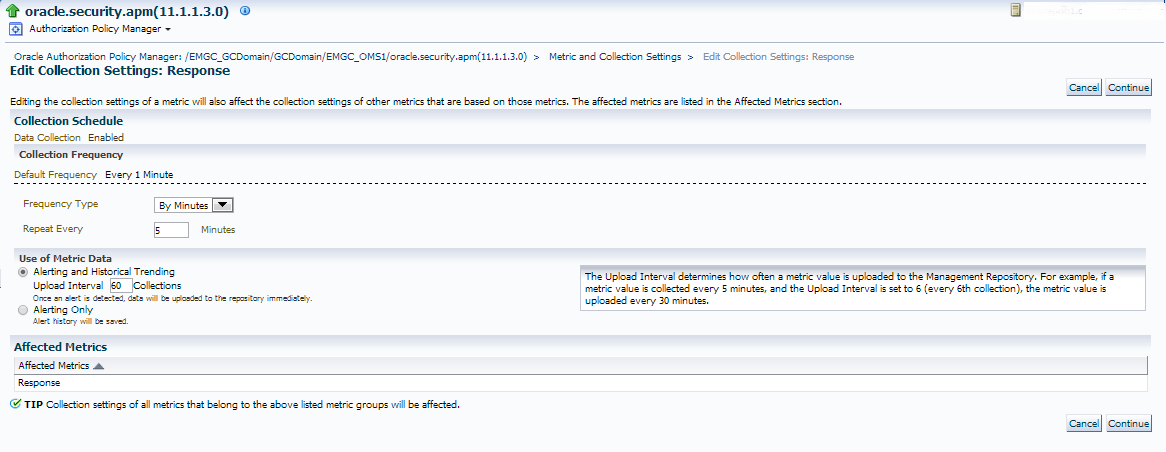
I now can continue and review my metric setting changes and if satisfied, save them and verify that the confirmation of the change has been received to the OMS.
This now means that this incident notification will ONLY be triggered if the incident occurs 3 times and the interval of collecting this information, (checking for an outage) will only occur once every five minutes. During heavy traffic times, I will not offer my OMS a bit of a break- less stress on it, and eliminate false availability incident creations.