
Application Performance Monitoring- First View
Working with test data is always fun and teaches those of us inside Oracle how best to use the new products that will be offered to benefit customers. To me, it’s pretty straight forward and I didn’t first understand why it was necessary, but as I sit in on calls as we do performance testing of these great, new products, I understand why they need to direct so many, so often. Anything performance is as much a mindset as it is a science.
Application Performance Monitor, aka APM, is no different. I didn’t exactly “follow” the hands on labs each time we’ve been taken through them, as I find it’s important for me to run through the product on my own and find out if its intuitive when I use it on my own.
I commonly ask myself a few questions as I review the results afterwards:
- Do I come up with the same conclusions, (or the same page as the lab expected me to,) even if I went about it a different way?
- Does the user interface provide me with the pertinent data I need to answer the questions the business is going to be asking when performance issues arise?
- How easily might a user be lead astray by data that has nothing to do with the culprit of the performance impact?
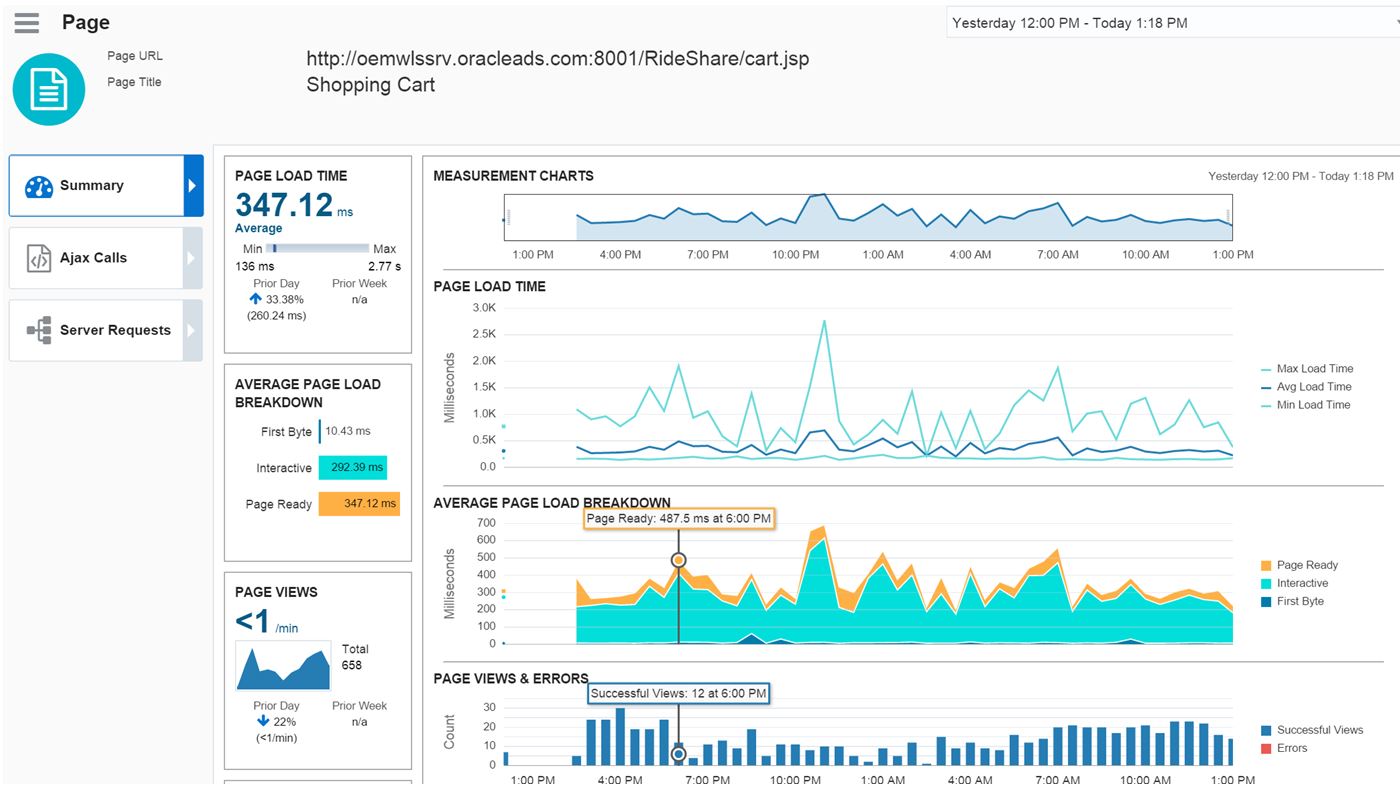
Slow Ajax performance is what we are experiencing in our example today.
Clicking on Ajax Calls will display this information and confirm the customers experience.
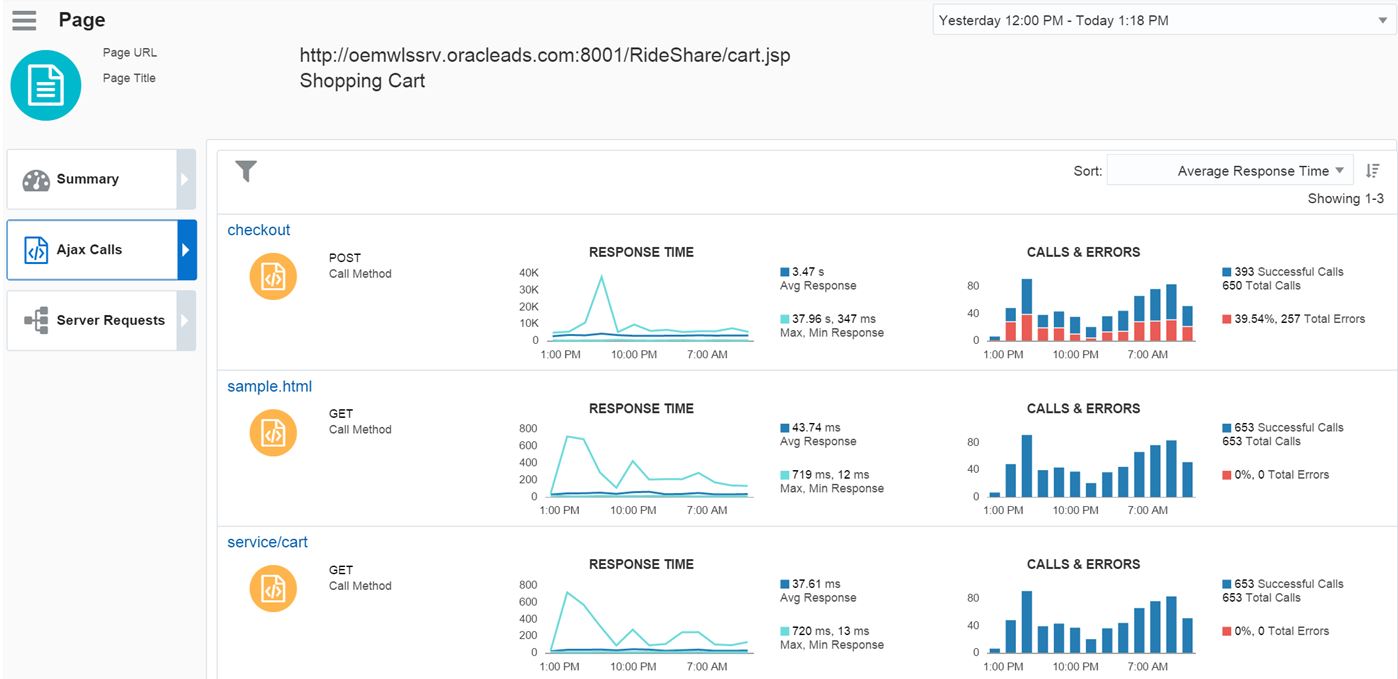
Notice that currently there is almost 40% errors, 257 errors in total. By clicking on Checkout, where the errors are showing, we can then drill down into the details:
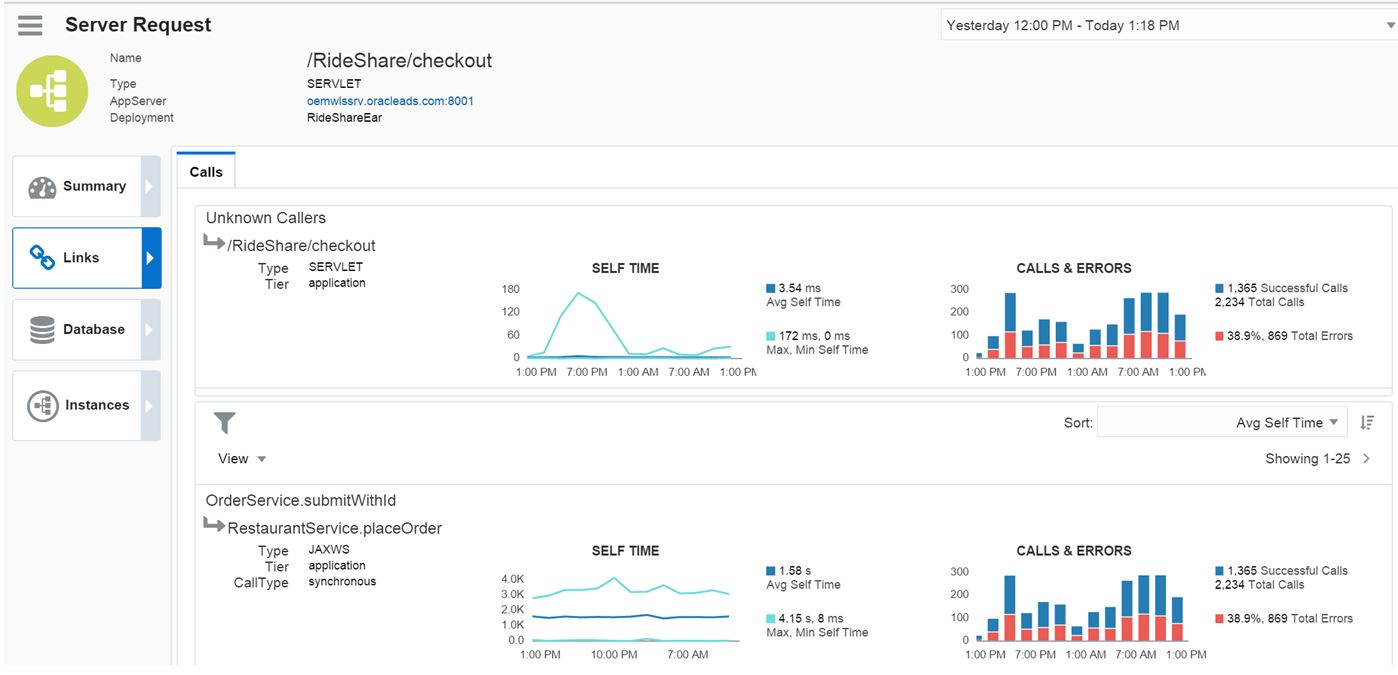
I then click on the link for the procedural call name, (/RideShare/checkout) and it takes me to a page that starts to break down the response time, (including faults, which we’ll focus on today) along with Calls and Errors, plus the Tier Average Response, (which includes the time spent on the AppServer calls vs. Database and External Calls).
If I click on the Links tab, I can see all the correlated links for this application and how they are performing. I can quickly see what calls are experiencing errors, (no matter if they are a parent call or a child call):
And what calls are NOT connected to the issue and aren’t experiencing any errors:
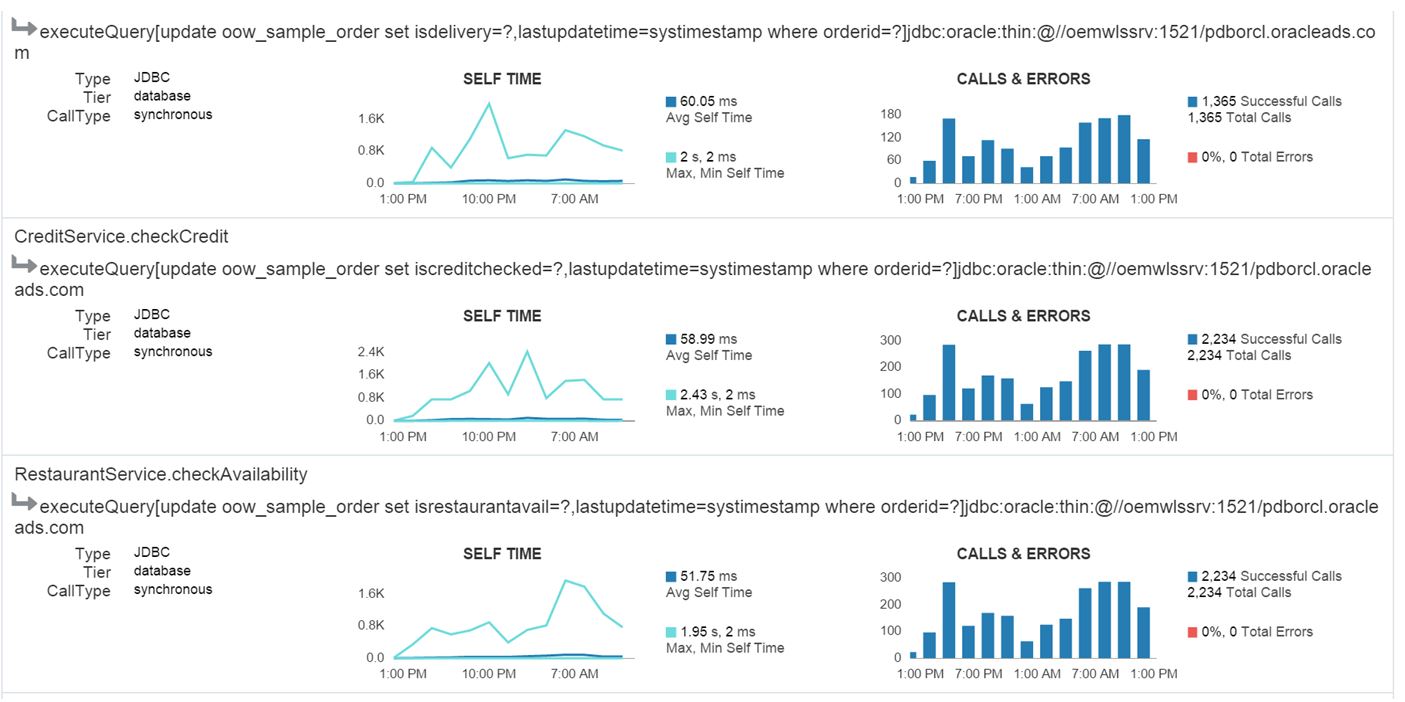
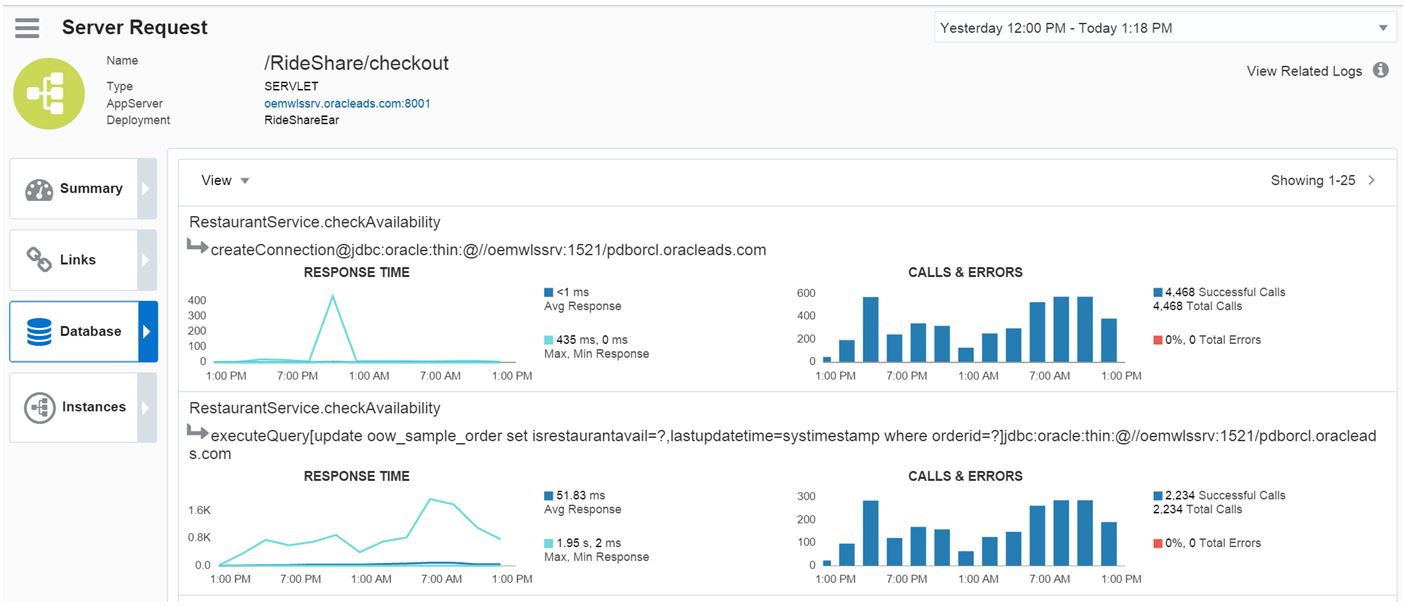
Although I’m only showing a snippet of the database calls, you can also click on the Database tab and verify that the database is excluded from the issue.
I click on Instances and it quickly shows a list of everything connected via ECID and reasons for the capture. For our experience today, we’ve focused on the ones listed by Fault.
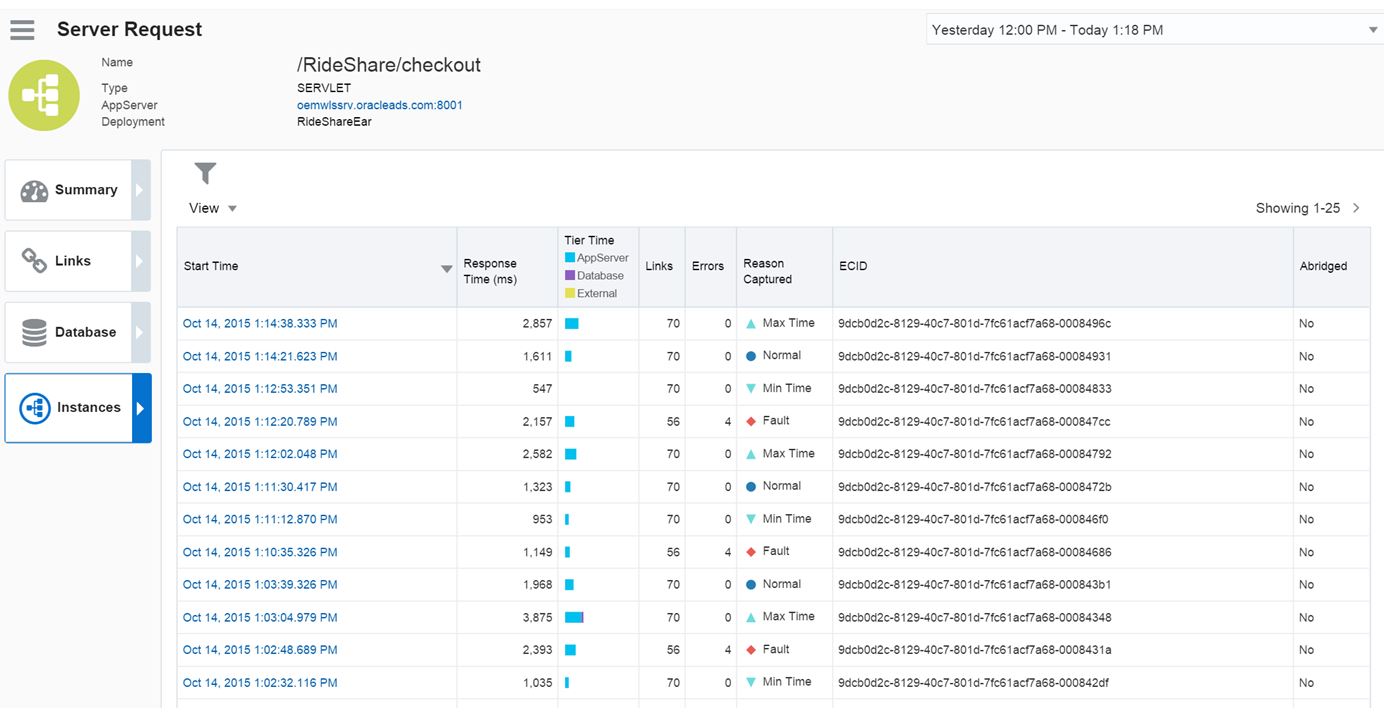
Now I can click on the Reason Captured and I can sort by Faults to see if there is a pattern to what is going on:
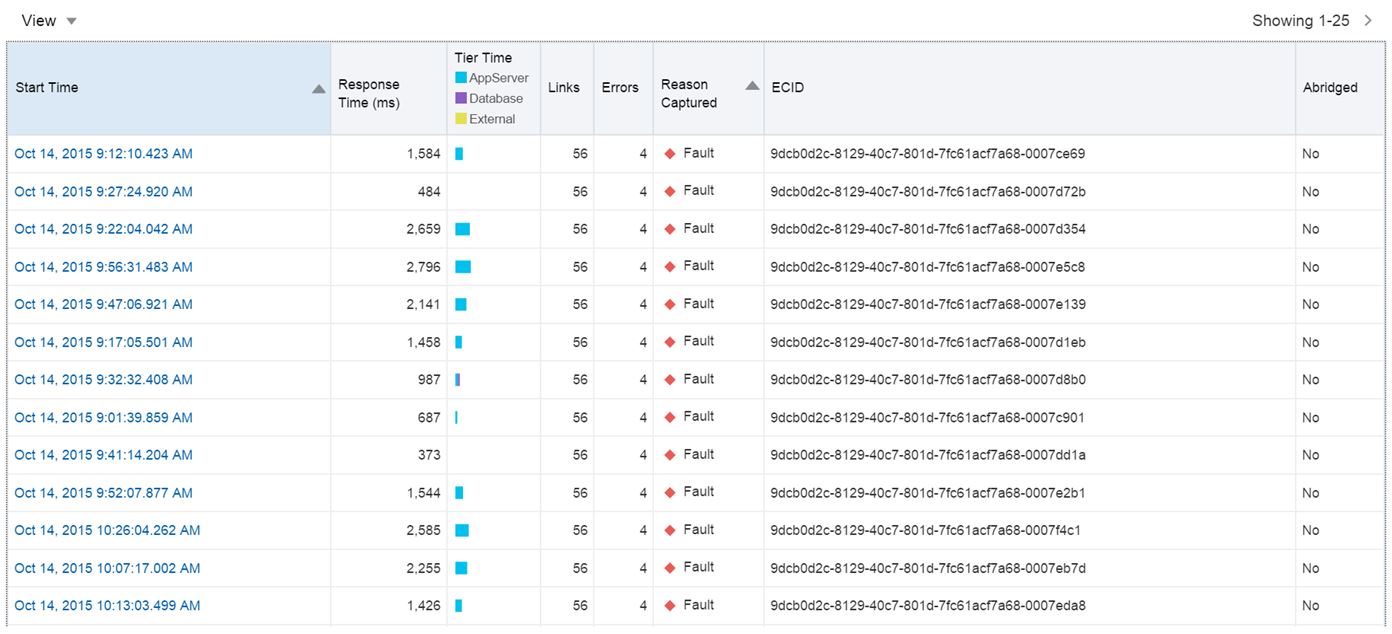
It confirms that all the issues are resulting from the App Server. If I click on one of the Instances that experienced the faults, it will then display the details of what occurred:
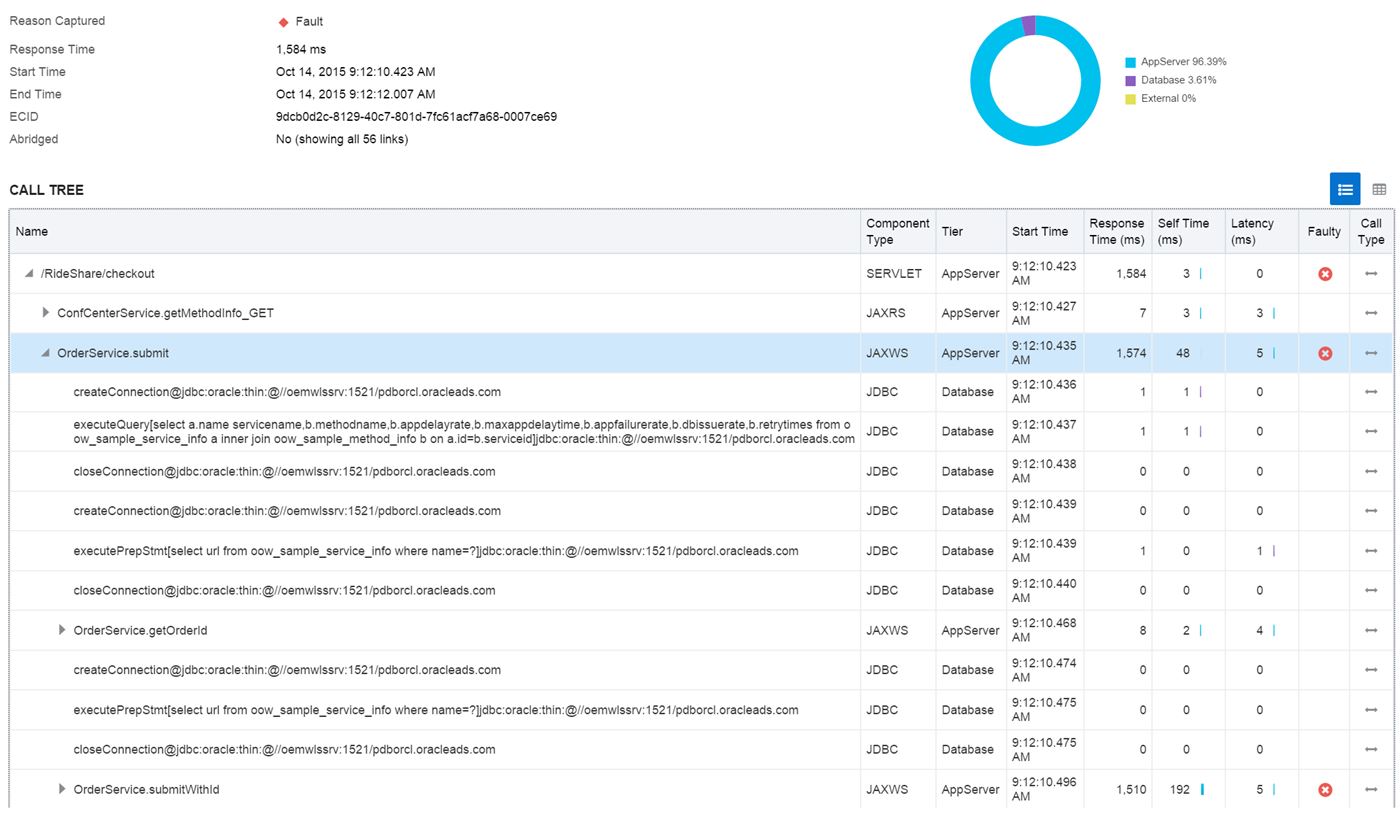
Notice that the checkout, when it calls the OrderService.submit, there is a failure when the OrderService.submitWithid is called. If we expand the view for this call, we get to see all the calls involved in this application code and can then see that the error occurs during the RestaurantService.placeOrder.
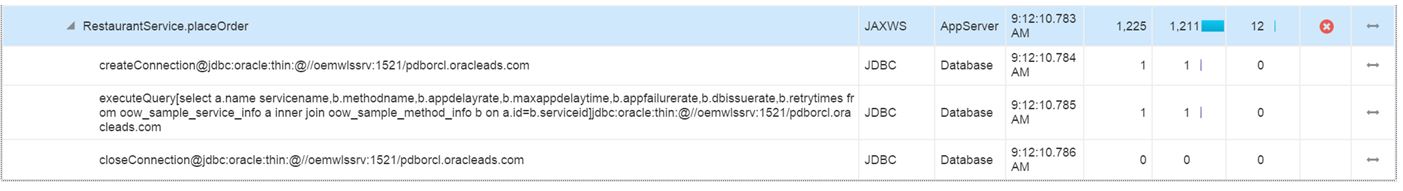
If you hover over the time “Self-time”, we find out that over 76% of the total time is spent on this step and is the source of the response time impact.
I can then click on the upper right and leave APM to Log Analytics, (which we’ll cover in detail in future posts) and View Related Logs, which gives me the log data that confirms what I’ve already found out from the Instance Information:
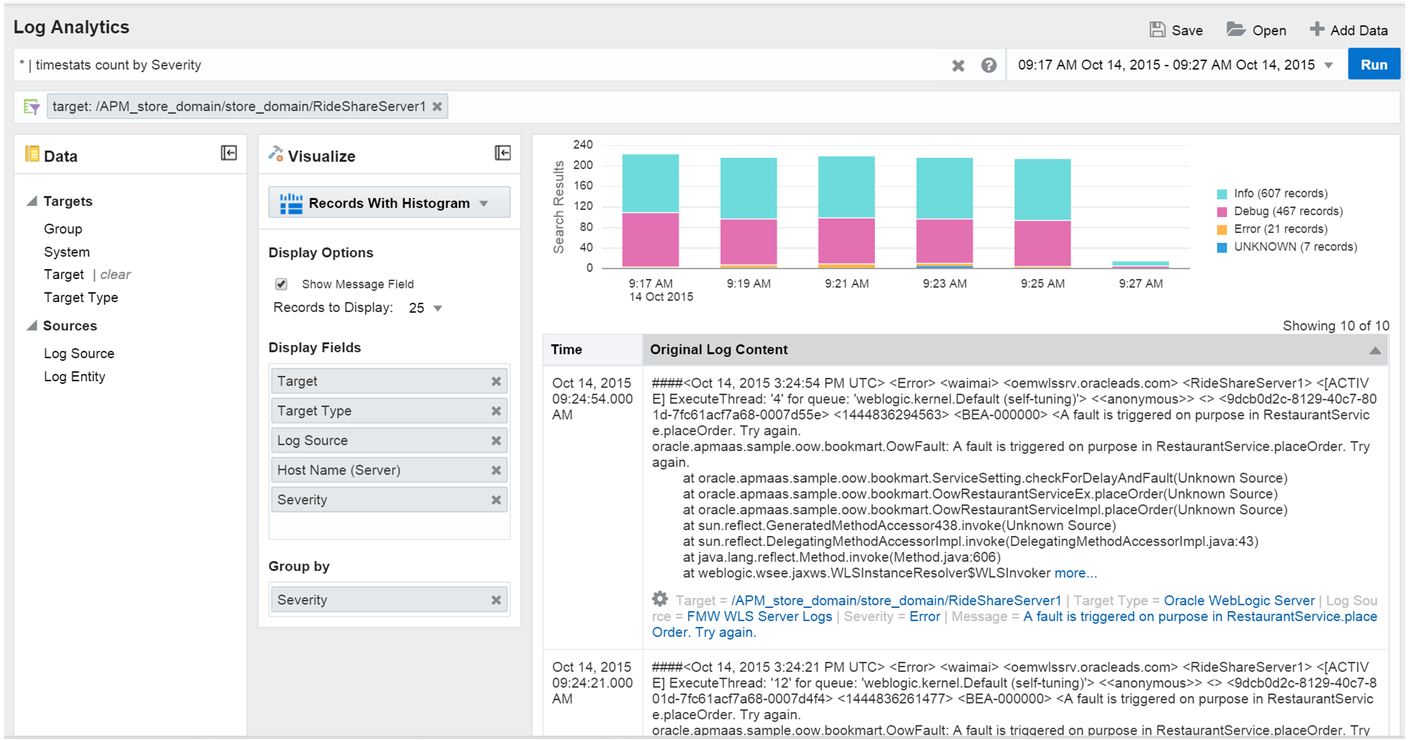
I prefer to check mark the “Show Message Field” to eliminate the need to parse the message out of the log text, (future tech tip for working with this product…) and again, you see the error that is experienced by the user when they try to submit RestaurantService.placeOrder.