This is another little known feature, but one you have to work with to get a solid feel for and find value in. When I came upon it in EM12c, I was not that impressed, but quickly became more impressed with the “just the facts” and “all in one” interface that it is, especially if you are working in a RAC environment.
Its another one of those features the DBA can stumble upon as they are working through issues, but to purposefully utilize it, the quickest way is after logging into the Enterprise Manager, click on Targets –> Hosts and then click on the host you wish to inspect thru the topology interface.
Once on this host, click just below the host name on the Host drop down button, then click on Configuration –> Topology.
The first view is quite simple- just the host:
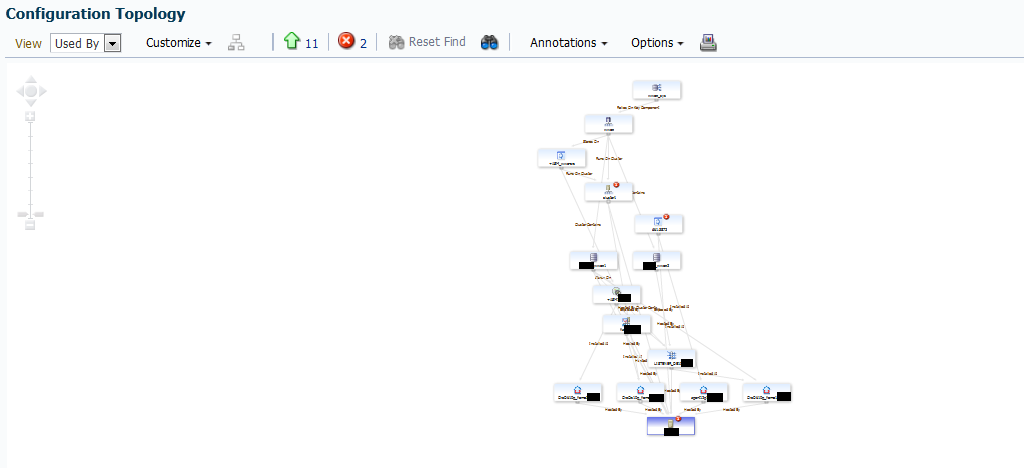
If you click on the drop down next to “View” where it has defaulted to “Uses” and click on “Used By”, the view will change, drastically if the chosen host happens to be in a RAC environment.
The default for the “Used by” view is a vertical layout, which I don’t prefer, having a widescreen on my laptop and this can be easily adjusted by clicking on Options –> layout –> left right.
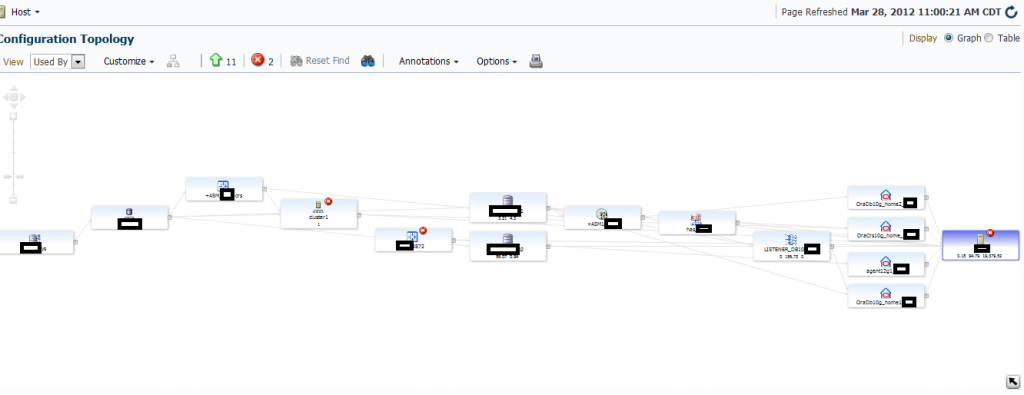
This gives you a display that can be zoomed and easily readable on a wide screen as is common these days.
1. You can drop and drag the topology layout on the screen to narrow in on anything you wish to concentrate on.
2. The boxes have notification symbols on any parent or child that has an event, incident or information that can be drilled down when you “hover” over the object.
3. By clicking on the object, a pane will appear with high level info on the parent or child.
4. That small pane can be expanded to offer more info, such as version, status and incident type.
5. There is a “more” link that can be clicked to open a larger info box with tabs containing even more detailed info.
6. Each box contains links to drill down to EM pages to address or read more details on the specified subject.
7. You have the ability to adjust the layout as complex as you would like to make it, including labeling the links between the node/db /listener/etc. relationships
8. You can print the topology map for reference.
The topology map, in its graphical interface, can be used in the following example:
Let’s say our goal is to become familiar with a new RAC environment’s physical layout, hardware, nodes and supporting structures.
Using the configuration topology, this becomes an easily accomplished feat:
We can see the toplogy, (already changed the view left to right…):
We can then Look at the relationships between the objects by changing the Annotations in the menu above the graph, choosing to show the status, incidents and/or link labels, also choosing how much metric detail we want to show in the graph.
The following close up shows you the information showed in the metrics data for each object:

Hovering over an object will show you more detail, which will open other panes with extended detail information and tabs about incident summaries,
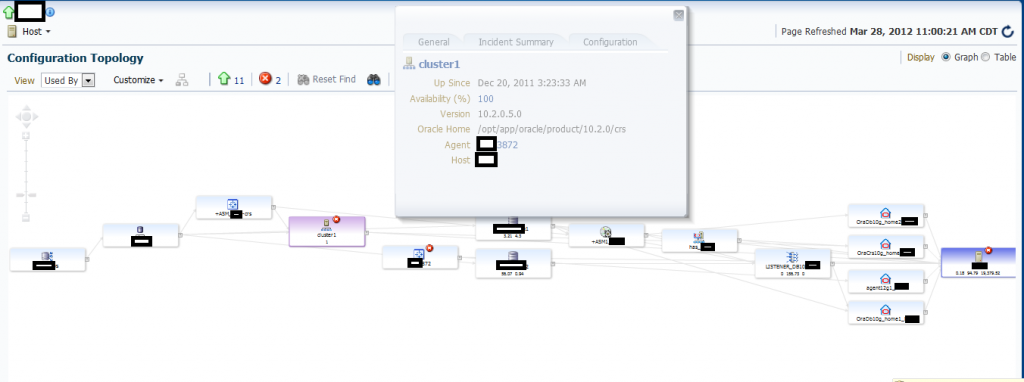
The picture becomes clearer as you continue to browse the topology of the enironment.
You can filter your view by what objects have critical incidents that need to be addressed, simply by clicking on the critical incidents, (the red circle with an ‘X’ in the middle of it..) above the topology graph:
You can also sort by the targets that are up by clicking on the green up arrow next to the critical incidents symbol.
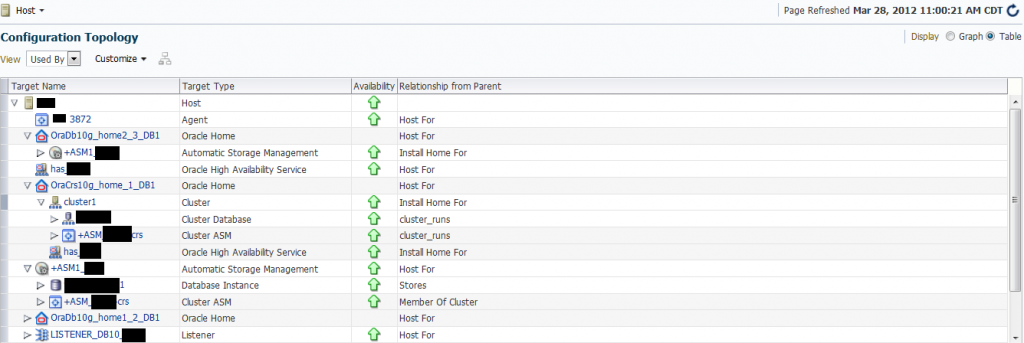
Now after all of that, if you aren’t a graph person, you can even switch it to table mode and drill down through the same features, just through a table format instead of the graph:
From this interface, either the graph or table view, a large amount of the EM12c features are available to the user. I highly recommend utilizing the UI to get a great view of the Oracle environment that the Enterprise Manager is privy to, allowing the DBA to have one more way to interact with monitored targets.
