
This question was posted in Twitter from @matvarsh30, who asked, “How can I display CPU usage over different periods of time for databases in Enterprise Manager?”
Everyone loves their trusty Top Activity, but the product’s functionality is limited when it comes to custom views and this is what our user had run into. There are numerous ways to display this data, but I’m going to focus on one of my favorite features in the product that was created to replace Top Activity, ASH Analytics.
Retaining AWR Data for ASH Analtyics
Note: This process to display CPU graphs will work for EM12c and EM13c. Other than the location of the target menu, not much else has changed.
The default display is for one hour and as ASH Analytics is dependent upon AWR data, so although 8 days of detailed information is easy, it is important that you set your retention in the source, (target) databases appropriately to ensure you’re able to view and or research past the default 8 day retention of AWR in any database. I am a firm believer that if you have the diagnostic and tuning pack for your EE databases, you should be getting the most out of these tools and up the retention time from the default by running the following command via SQL*Plus with the appropriate privileges:
BEGIN
  DBMS_WORKLOAD_REPOSITORY.modify_snapshot_settings(
    retention => 86400,        -- In minutes, 86400 is 60 days
    interval  => 30);          -- In minutes, only change from 60 if doing workload tests, etc. 60 min interval is sufficient.
END;
/
Now you have not just the EM metric data that rolls up, but the AWR data for ASH Analytics to do deep analysis and reporting.
With this in place, let’s create some graphs that answer the question – “How do I display CPU usage for a database over one week, 10 days, 30 days, 60 days?”
Default to Power User View
Once logged into any database, you can access ASH Analytics from the Performance drop down. If you have an 11g or earlier database, you may have to install the package to create the EMCC views, but this will need to be done to utilize this powerful tool in Enterprise Manager. ASH Analytics works in databases version 10.2.0.4.0 and above.
Logging into ASH Analytics will display data for the instance based off one hour, but to change to a one week view, you’ll simply click on “Week” and then move the displayed view for the bottom section graph out to encompass the entire week:
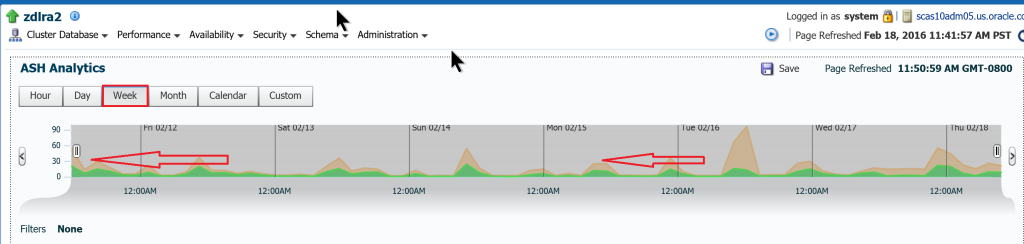
Using this example, you can then see that I’m now showing a similar graph to Top Activity, but for a whole week and without the aggregation that Top Activity some times suffers from.
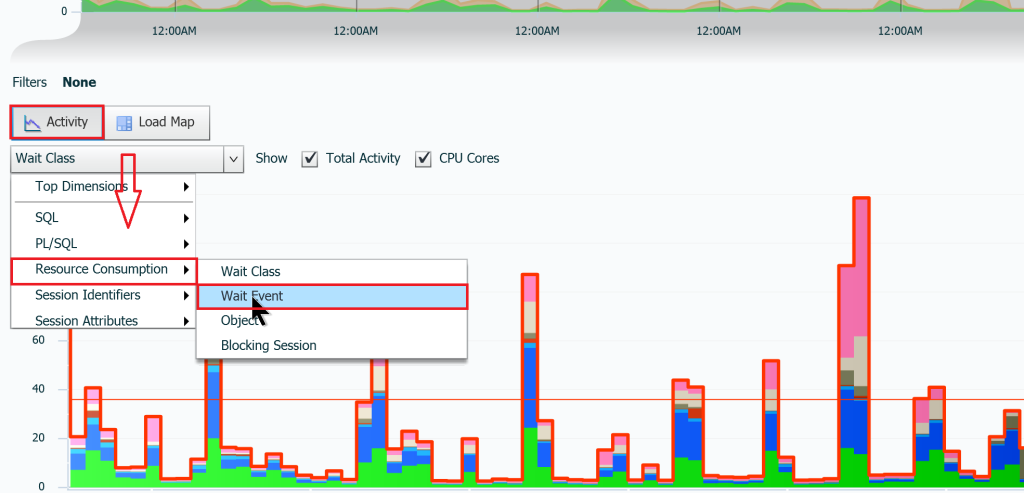
We’re not going to stick with this view though. Leaving it on “Activity”, click on Wait Class and go to Resource Consumption and click on Wait Event, (it’s on Wait Class by default.)
As you can see on the right side, there is an overlap in the legend that needs to be fixed, (I’ll submit an ER for it, I promise!) but luckily, we’re focused on CPU and we all know, in EM, CPU is green!
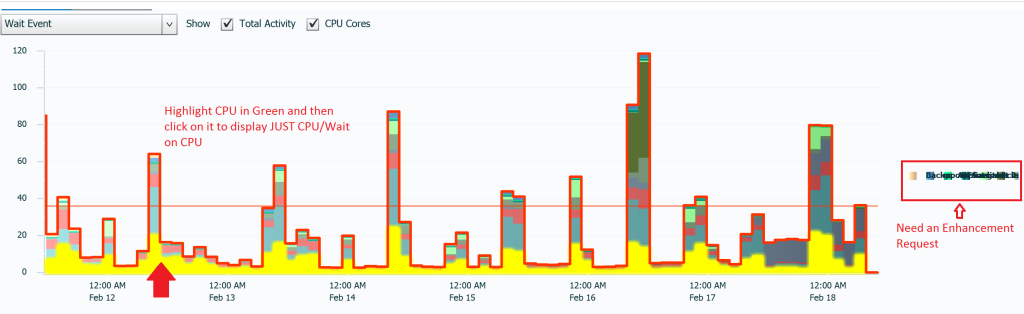
When we highlight the green, it turns a bright yellow. Now that you have chosen this by hovering your cursor over it, double click to choose it. The graph will now update to display CPU:
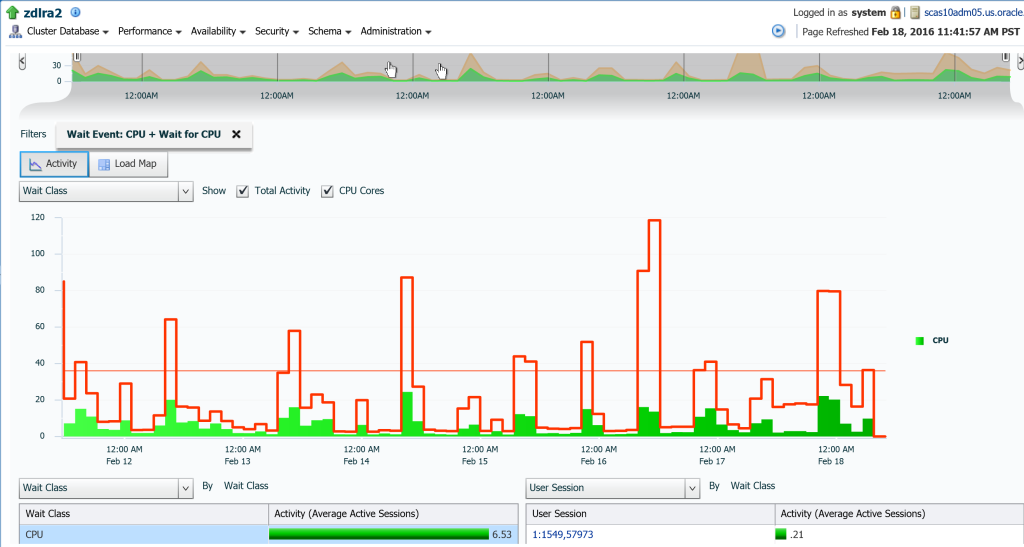
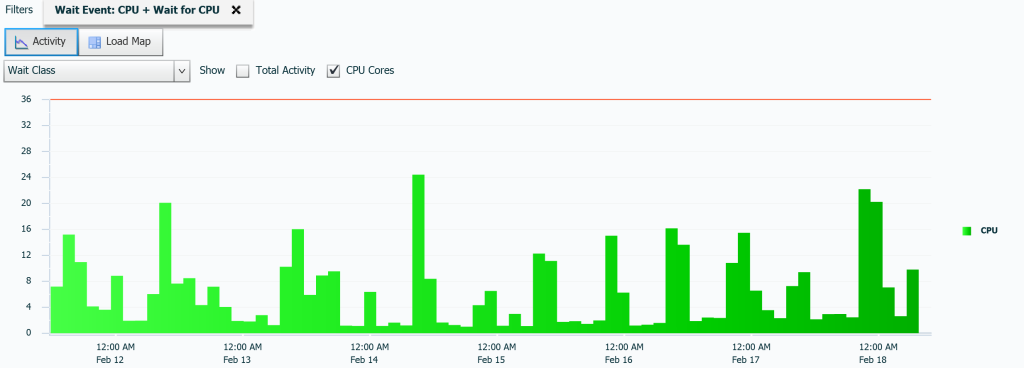
You now possess a graph that displays all CPU usage for over the last week vs. total wait classes. You can see the overall percentage of activity in the left hand side table and on the right bottom is even displayed by top user sessions. You can also see the total CPU cores for the machine, which can offer a clear perspective on how CPU resources are being used.
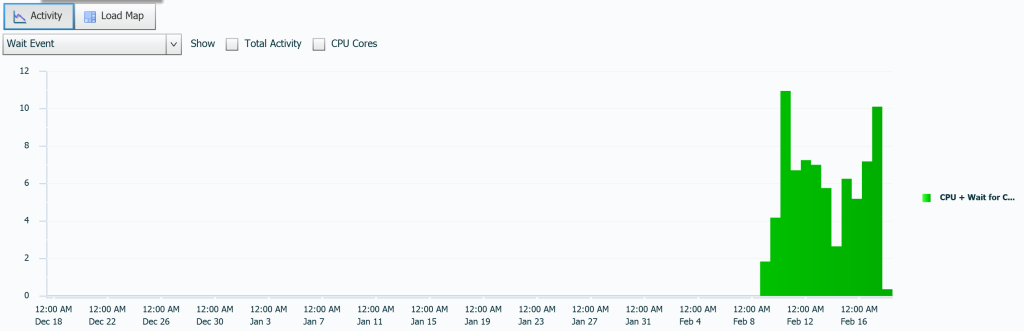
Now you may want to see this data without the “white noise”. We can uncheck the “Total Activity” box to remove this information and only display CPU:
We could also choose to remove the CPU Cores and just display what is being used:
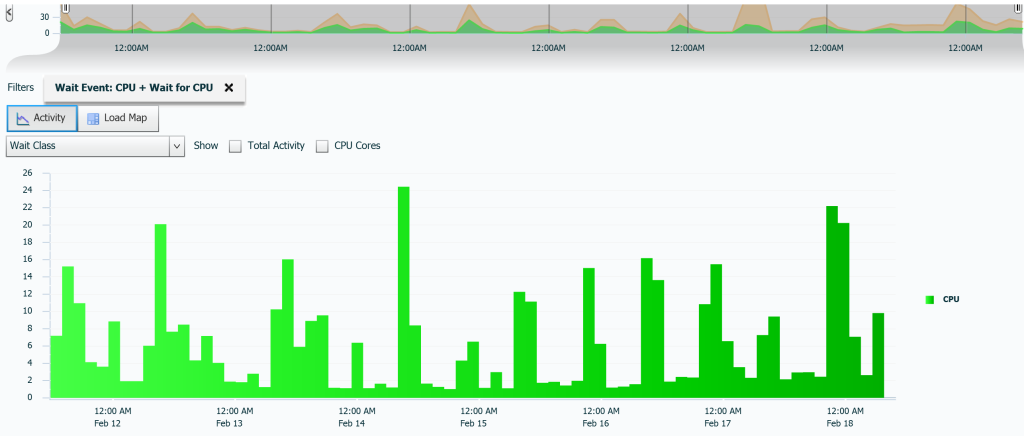
By removing the top core info, we see the patterns of usage and just cores used much clearer. We could also decide we want to view all the wait classes again, without the CPU Cores or Total Activity. The only drawback is the overlap in the legend, (I so hate this bug in the browser display….)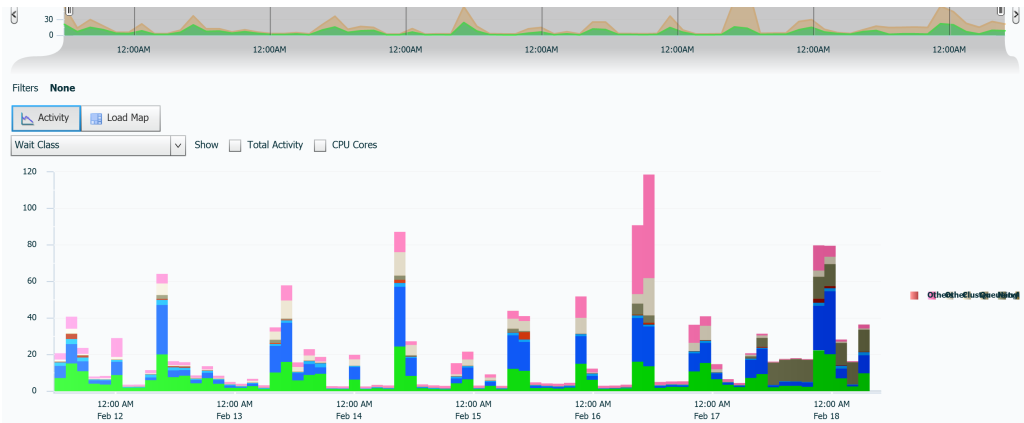
Now, as requested, how would you do this for 10, 30 and 60 days? As noted in the top view, you note that you’re offered a view by hour, day, week, month and custom. As many months have 31 days in them, you may choose to do custom view for all three of those requests, but a custom request is quite simple:
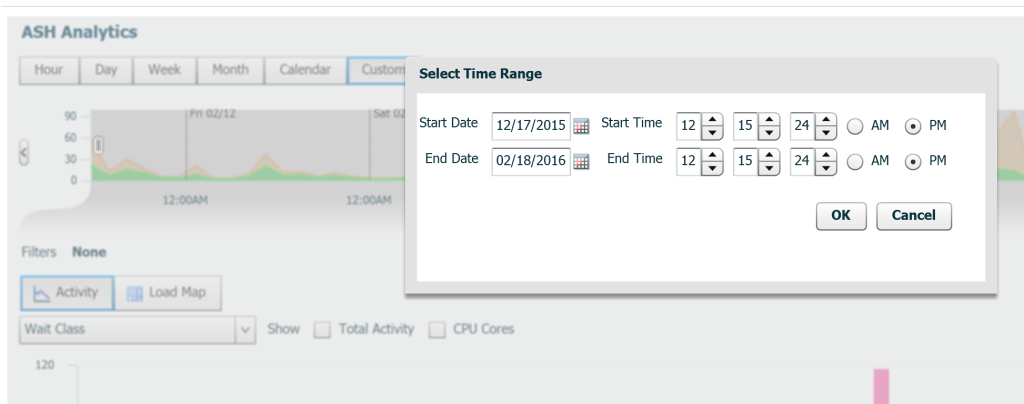
Yep, just put in your dates that you request and then click OK. If you have already stretched your window to beginning to end on the lower view, don’t be surprised if it retains this view and shows you all the data, but yes, all of it will display, that is if your example database was active during that time… 🙂 Yes, the database I chose, as it’s from one of our Oracle test environments was pretty inactive during the Christmas and January time period.
And that’s how you create custom CPU activity reports in ASH Analtyics in Enterprise Manager!
