*Previously posted on the Data Architecture Blog for the Microsoft Tech Community.
Oracle is a unique, high IO, workload beast, but it’s important to recognize it’s more often an ecosystem made up of an Oracle database, applications and often other databases that all must connect, feed and push data to users and each other.
When migrating to the cloud, the architecture discussion about what apps will be placed on what VMs, in what region, availability zones and even availability sets occur, but many forget that Azure is an enterprise cloud and as such, is massive in scale, let alone that we have over 200 datacenters. With this scale comes a unique learning curve for technical specialists to pivot their view of how this differs from their on-premises datacenter view. We talk about regions and availability zones (AZ) which may not provide as much transparency that we really need to understand the complexity that goes into HA, redundancy, scaling and distance.
Same Bat Problem, Same Bat Channel
I was brought into two scenarios this week with Severity 1 tickets and I was asked repeatedly how I was able to quickly identify the issue with diagnostic data provided by Oracle and Azure that appeared hidden to so many. I also have to admit that Oracle focuses on what is the responsibility of the database in their wait events captured in the Automatic Workload Repository (AWR) or its predecessor, Statspack, and as Oracle considers the network outside of the database’s responsibility, the waits may be missed if you don’t know what you’re looking for. Oracle lists some valuable info around the waits, but sets a clear boundary that the network is beyond the database.
For both customers in question, irony would have it, the complaints were about IO performance. First on the scene tried to scale the VM and storage and as nothing changed, became frantic and located me through the internal Microsoft network. I quickly asked for both Oracle diagnostic data and Azure internal diagnostic telemetry from Microsoft Support. These tools provide an incredible amount of valuable diagnostic data, marry well together, and provide a data-driven picture of what is really happening that we can then address at a time-consumed level vs. just implementing products or resources at the problem hoping it might offer a resolution.
For the first customer, they didn’t have any AWR or Oracle’s free version, Statspack data to show us what the system performed like before the changes made. Yes, I wasn’t going to have an easy time of this one. I quickly guided them to install Oracle Statspack on the database and then proceeded to identify where time was being consumed and optimize, as understanding what happened before this was going to be difficult at best.
As the database is always guilty until proven innocent, Oracle was quick to point to latency around the redo logs which resided on the same storage as the datafiles. After separating these from the data, there was only a 35% increase in performance vs. 100% which told me that the VM and the database weren’t the real issue. I’d just fixed a problem that had been present the whole time and needed to dig deeper into the data.
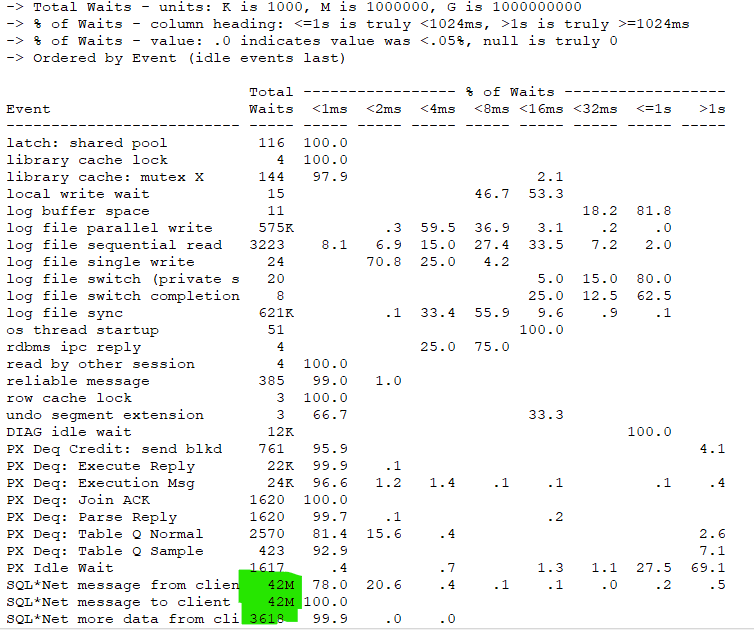
As discussed earlier, Oracle doesn’t consider the network “it’s problem”. The diagnostic tools still track high-level information on the network, which is displayed in data around SQL*Net Message to/from client:


As this is Statspack, the number of Total Wait Time in seconds isn’t formatted to present such large numbers, so all you get is ############. This is a large red flag, even if SQL*Net isn’t shown as a top 5 wait event. This was quite far down the list, but SQL*Net notice the WAITS and WAITS/TXN. The values demonstrated there were waits happening between the database VM and those VMs interacting with it. Upon investigation, I could see there were both applications, SQL Server and an Oracle app server all in the top connections to this database.
I was also able to view the total waits in MB and the amount of time spent on those waits, which quickly showed, it was the largest ones of all:

Our Last Bottleneck
I think we can easily forget the network is our last bottleneck, especially in the cloud and for multi-tier systems, where all targets, (VMs, servers, containers, etc.) should be treated as one unit. What needed to be understood, was when maintenance or changes that require a VM cycle occur, a restart runs the risk of one or more VMs to redeploy in a different location in a data center or region, depending on availability and configuration.
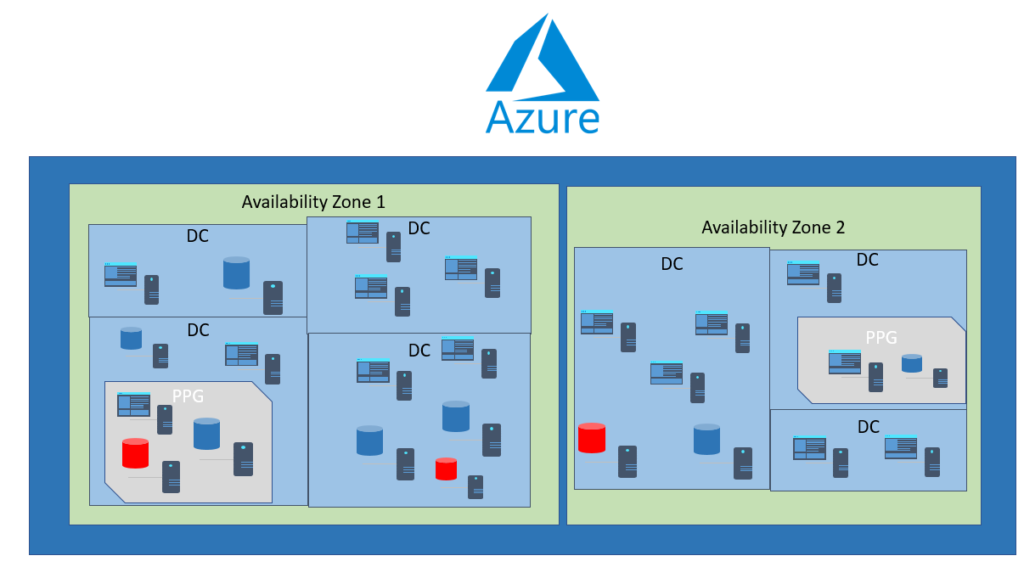
As I didn’t have diagnostic data from before the performance change, I could only go off of what Oracle statspack was telling me and then confirm with Azure diagnostic data that each of the VMs involved in this “ecosystem” wasn’t connected as part of a Proximity Placement Group. To understand where PPG’s lie in the hierarchy of Azure, think of it this way:

Notice that the PPG “groups” the application VMs and database VMs inside the AZ, letting Azure know that these resources are connected, even if they are in different resource groups or using different virtual networks. If you’re looking for resiliency and using Oracle, consider Data Guard and have replication to a standby in a second AZ. If using SQL Server in IaaS, then you’d do the same with Always-on AG, replicating the application tier to the second AZ with Azure Site Recovery (ASR) or similar.
For the first customer, as I’d also addressed the redo log IO latency issue, the performance improved 200% after the PPG was added for the involved VMs and blew the customer away. For the second customer, I expect similar increases in performance based off the AWR data but will have to wait until they send me the AWR report after the changes that are still waiting for a window to deploy. If you look at the high level AWR diagnostic data from the second customer, you’ll notice a trend in waits similar to the first customer:
Foreground Wait Events
| Event | Waits | %Time -outs | Total Wait Time (s) | Avg wait | Waits /txn | % DB time |
| log file sync | 2,418,416 | 126,918 | 52.48ms | 1.05 | 55.33 | |
| enq: TX – contention | 130,455 | 35,409 | 271.43ms | 0.06 | 15.44 | |
| SQL*Net message from client | 93,868,885 | 4,846,357 | 51.63ms | 40.72 | ||
| SQL*Net message to client | 93,722,245 | 125 | 1.34us | 40.66 | 0.05 |
Although still not considered Oracle’s problem, the AWR at least identifies that the SQL*Net waits should be looked into.
With the PPG in place, both customers can comfortably deploy changes knowing the VMs involved will be closely located in a single data center to decrease network latency and new VMs that need to be connected can be added to the PPG afterwards.
Incorrect compute SKU family, storage type, redo log latency and connectivity between database and app server are the most frequent issues we see for customers in Oracle on Azure IaaS. I discuss the first two in posts often, but we’re now going to start to discuss the next tier of performance and how easy it is to identify and resolve with the diagnostic data provided by Oracle and Azure.
Performance Improvements
Once a PPG is created for involved VMs for an Oracle “ecosystem” the wait times clearly decreases and performance, although outside of Oracle’s control is quickly resolved with PPG from Azure, but the resolution wait times is demonstrated in AWR or Statspack reports, (or in queries directly to the Oracle v$ and historical wait event objects.)
For the first customer, the %Total Call Time dropped from 70% to less than 6% and you’ll notice the decrease in waits on the log file wait events then pushes the overall percentage up for what is now viewed as the new bottleneck: db file sequential and scattered reads:


As we corrected the SQL*Net waits, those have also decreased drastically, allowing for much better performance, not just experienced by the customer, but seen in our diagnostic data, too.
Summary
Recommended practice for any Oracle multi-tier system, such as E-business suite, (EBS) Peoplesoft, Hyperion, Essbase, etc. or Oracle database/applications deployed a multiple VMs in Azure is to use a Proximity Placement Group to deter from network latency across multiple datacenters in a region or Availability Group. High Availability and DR should be architected based on Recovery Point Objective (RPO), Recovery Time Objective, (RTO) and any SLAs the business is held to if there is an outage or impact to user access.


