
ASH Analytics- Activity Focused on SQL Data, Part I
I have a request to hit on some EM performance blog posts, so we’re going to start with breaking down some of the ASH Analytics areas. ASH Analytics is not your grandfather’s “Top Activity” and I recommend everyone begin to embrace it as it is the the future of performance activity in the Enterprise Manager. The idea that we will be able to pull directly from ASH and AWR to present our performance data via the EM12c is exciting, to say the least. The added accuracy and value of the aggregated historical data must be recognized as well.
The standard output for ASH Analytics looks quite similar to Top Activity in the way of focusing on activity graphed out by wait events, but I’m going to dig into a different ways to present the activity data, as it may answer questions that simply won’t show via wait event graphing.
Once you first enter the ASH Analytics interface, you’ll be presented with the section at the top, which will display the timeline for your examination and then below, the actual wait event graph as seen here in our example:
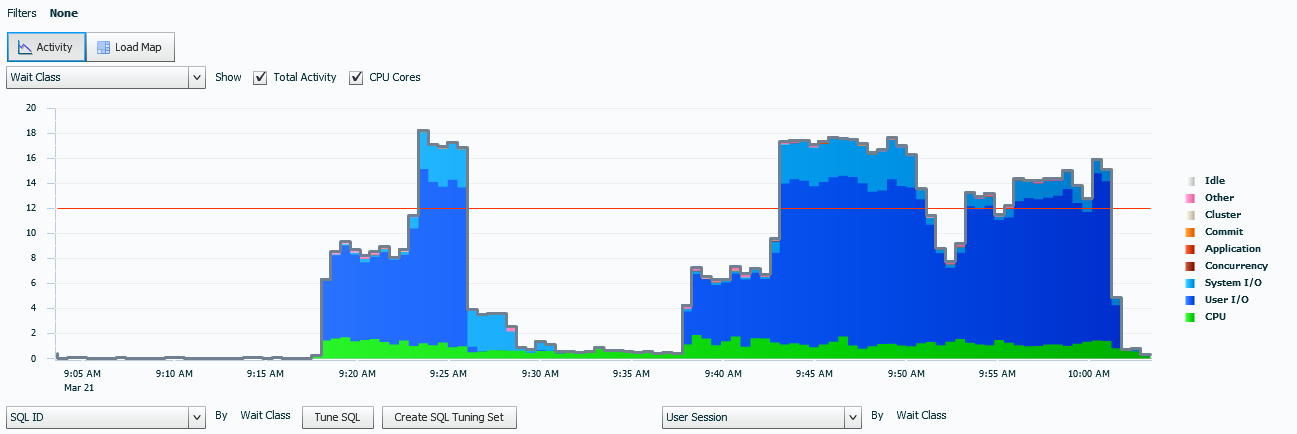
You’ll note that we haven’t used any filters, so we’re viewing all activity data and the standard wait classes we are accustomed to viewing as shown, i.e. I/O, (dark blue) CPU, (kelly green) and System, (light blue). We can see the system is rather busy during multiple intervals, bypassing the CPU cores line, displayed in red across the image.
Now let’s display the data in a different format. This is done by changing the Wait Class, shown under the Activity button, to another filtering type.
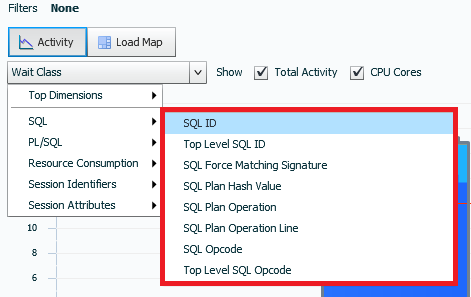
The section highlighted in red is where we will be spending our time today. I’ll display the same section of time we see in the standard wait event displayed in our standard wait event view, but focus on the SQL defined displays and we’ll go over how they might assist you in troubleshooting an issue.
SQL_ID
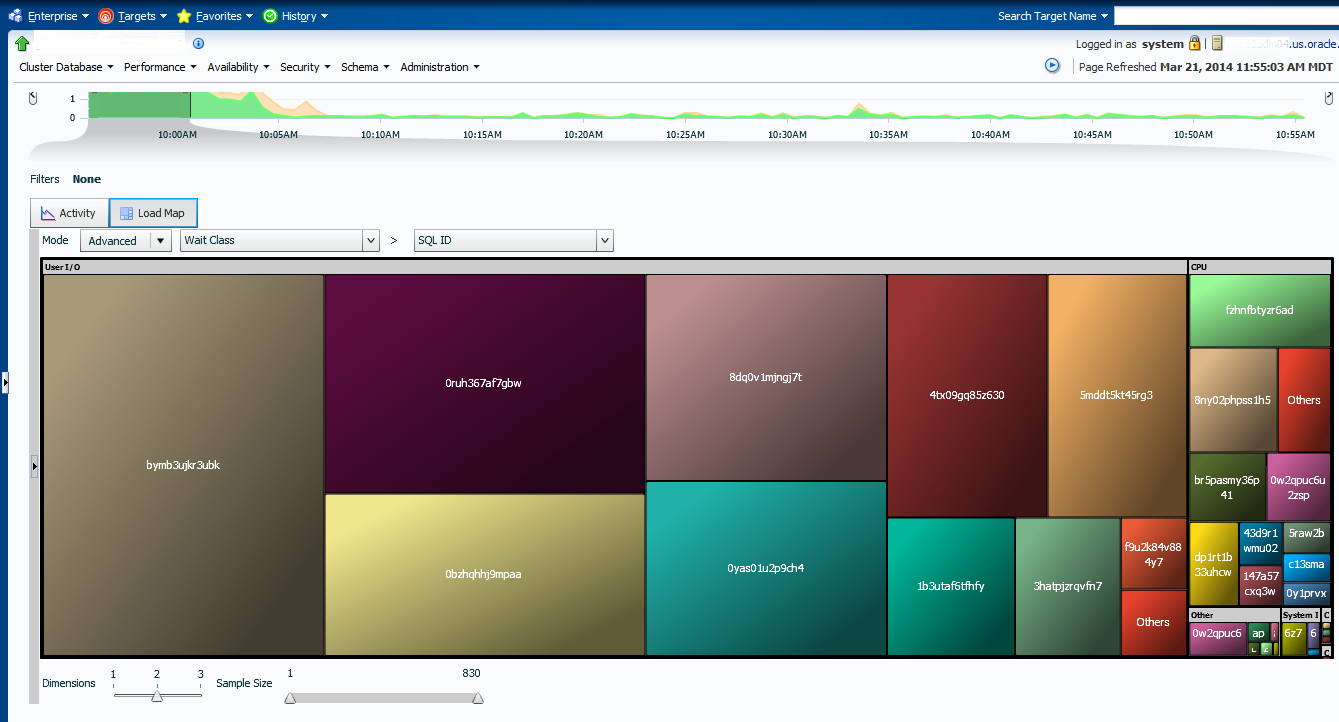
Now this one might seem a bit self-explanatory, but displaying the data from the activity pane appears very different, then, let’s say from the load map:
Now let’s look at it from the Activity View defined by SQL_ID:
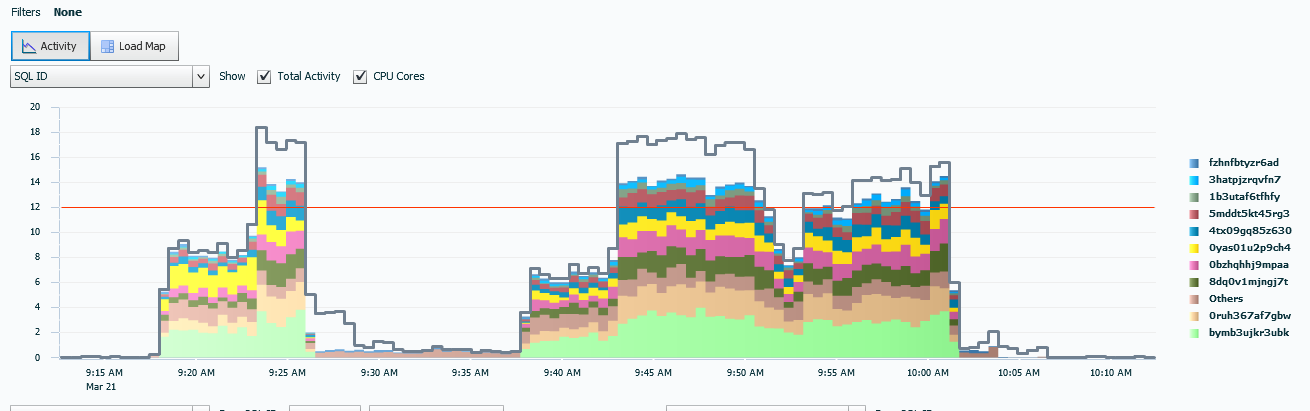
I find the load map an excellent way to get my point across to non-technical folks, but I’m a DBA- I’m used to spending my time looking at the data in terms of activity, so this is a more comfortable view for me to move from seeing the data in terms of wait events and transitioning that view to seeing the percentage of activity allocated to each SQL_ID.
We can click on the SQL_ID displayed on the right to go to it’s detailed ASH page, which will show you all data pertaining to that SQL_ID and wait information involved with it. By clicking on different sections, we’re not just digging down into more detailed information, keep in mind, we are also “filtering” out more data that could have been masking valuable information.
Top SQL_ID
You may also think that this one is not going to look any different than the last, that’s where you’re wrong. This is not the SQL_ID that has resources allocated to it in activity, but the top level SQL_ID that is executing the SQL_ID active. This is helpful if you are trying to locate what packages and procedures should be first on the list for code review or if you want to quickly locate the package or procedure responsible for a specific SQL_ID.
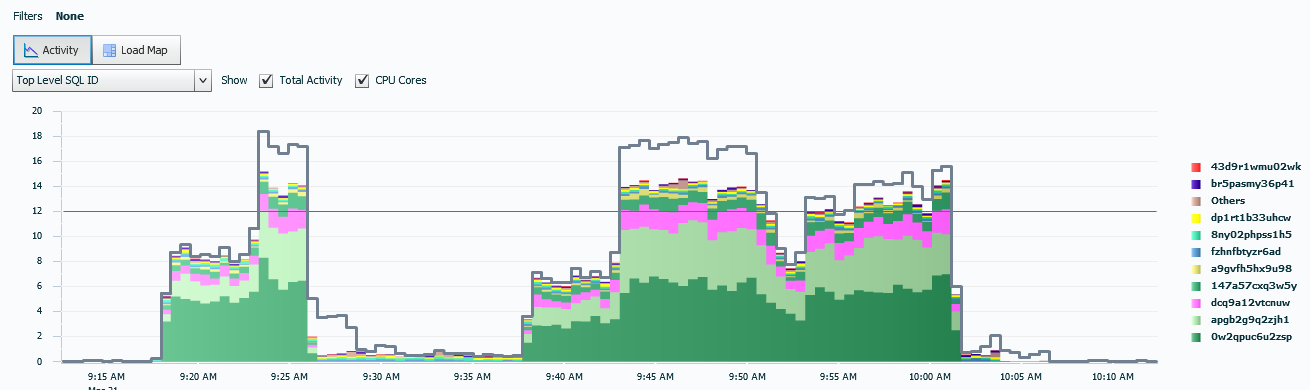
These can then be identified to sessions by clicking on links and then traced to users, hosts, etc. If I click on one of the top SQL_IDs, it will take me to all SQL_ID’s involved in that Top SQL_ID and all the wait events, displayed in the same graph timeline. From there, I can then dig down into the data pertaining to the waits, the SQL_ID’s involved as part of the Top SQL_ID or even switch to other views, such as a load map to present the data in another format for peers to view more easily.
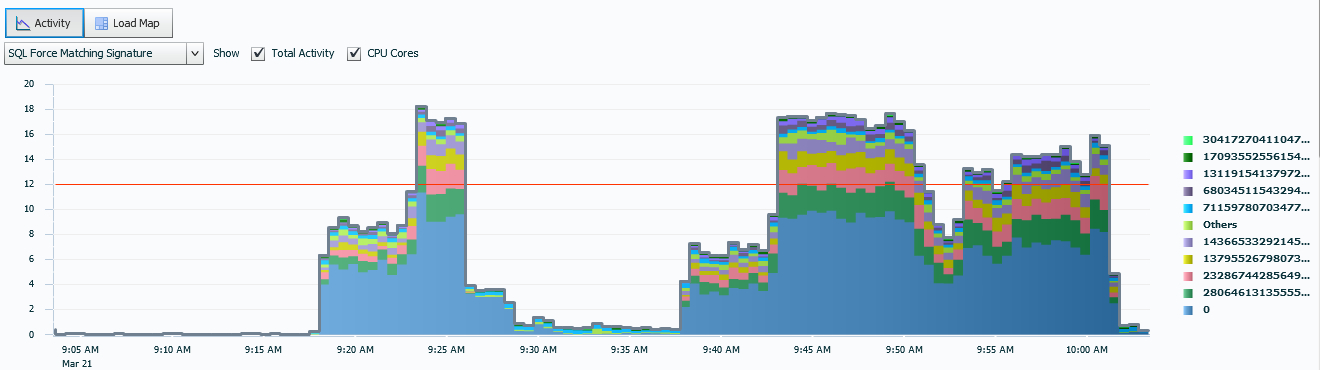
Force Matching Signature
Force matching signature is a way of ensuring that SQL is using the same plan/profile, etc. even when it has literals in it. It’s kind of like setting cursor_sharing=FORCE, but in a “hinted” way throughout a database. This can be both good and bad, as let’s say that it forces the value to “1”, where the value “1” really only makes up 2% of the rows and it would have been better if it knew what it was working with.
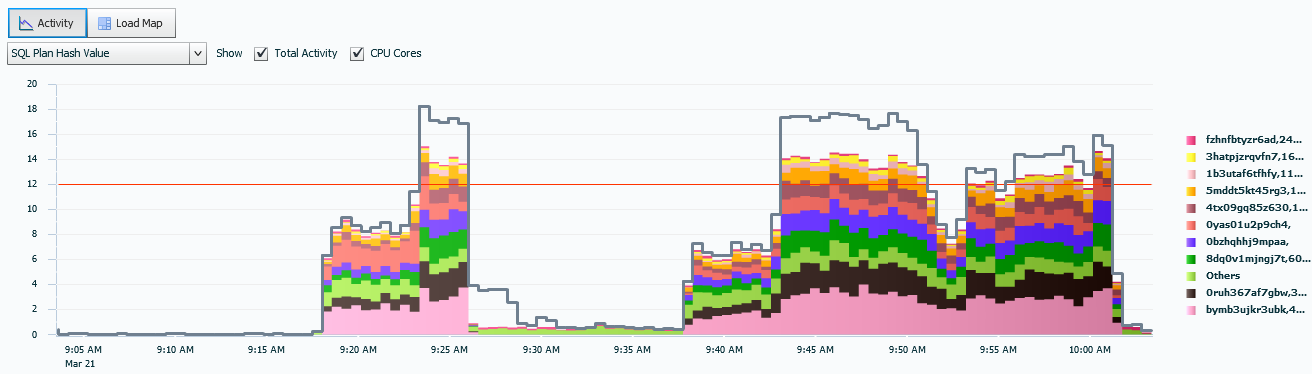
SQL Plan Hash Value
You should be seeing this next image [hopefully] as a mirror of the SQL_ID one. We do like plan stability and the idea that we have a ton of hash plan values changing erratically is enough to make most of us feel queasy. Having a quick visual that we’re not experiencing a lot of plan changes can be quite helpful. It’s not foolproof, again, this is a visual representation of the data, but it’s helpful.
SQL Plan Operation
If you’re a DBA managing a data warehouse, you know when any DML is running and on what schedule. The SQL Plan Operation view can give you a quick verification if something is amiss and there are updates, deletes or inserts happening that shouldn’t be. You can see the percentage of activity that may also quickly tell you a change has occurred vs. the normal database activity.
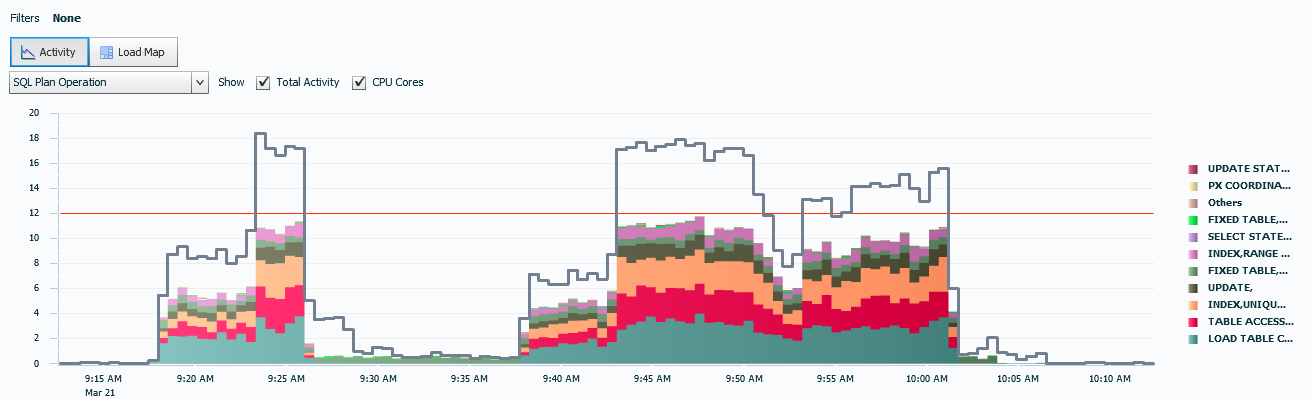
You can also see just how much of your activity is going to certain type of processing.
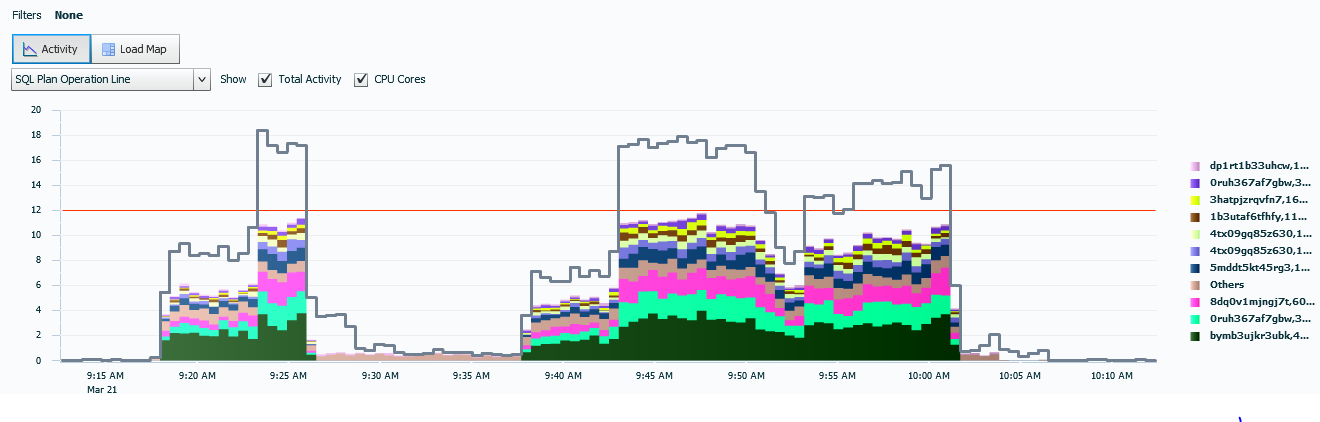
SQL Plan Operation Line
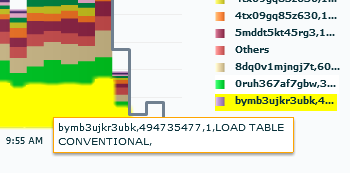
The plan operation line, you can see the operation type for the process, along with the description. the process is then broke down by both the SQL_Id and the step the statement is performing.
If you hover over any SQL_ID listed, it will also show this to you in the highlighted area:
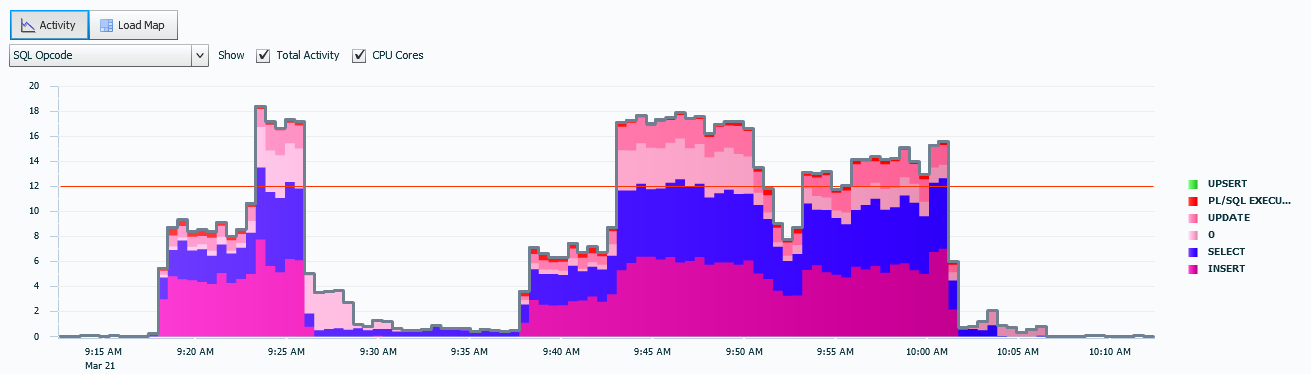
SQL OpCode
This one is self-explanatory. We are simply looking at the activity level per statement type. It is easy to see that during our busy intervals, queries were around a 1/3 or the activity, as were inserts. This view can be helpful if you are retaining screenshots at different snapshot intervals for comparison.
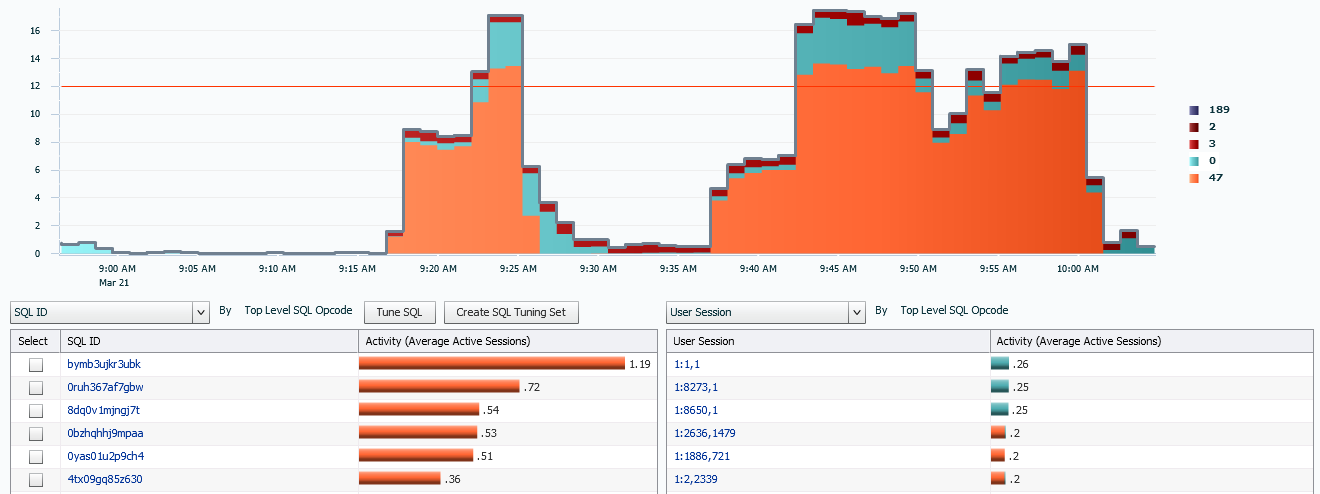
Top Level SQL Opcode
You can also view the data simply by Operation code, displaying by each code. Notice that these are displayed by the Instance number, (if on RAC), Session ID, (sid) and Serial number, (serial#). This is a global view of the operations that are occurring in the environment and can offer a clear view of activity, but at an operation type level.
We’ve just touched on what the SQL section of the ASH Analytics Activity view can offer. Stay Tuned and we’ll dig into each section and each area of this great interface for performance monitoring and analysis.
Pingback: ASH Analytics- Activity Focused on SQL Data, Part I - Oracle - Oracle - Toad World
Pingback: Kellyn Pot’Vin : ASH Analytics- Activity Focused on SQL Data, Part I | Database Scene
Pingback: ASH Analytics- Activity Focused on Resource Consumption, Part II - Oracle - Oracle - Toad World