
This is the second post on ASH Analytics Detail. You can find the first post here.
This post we’re going to work into more Activity data within ASH Analytics, but I’m focusing on Resource Consumption, which you can find once you are into Ash Analtyics, (you may want to stop refreshes, which can be done at the upper right in the refresh settings) under the Activity button.
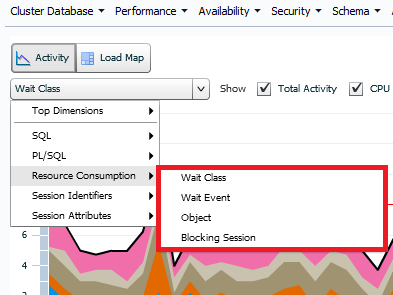
We’ll be working with the last three options in this menu marked off in red, as the Wait Class is just a similar view of what we already get in the main Activity graph.
Wait Class
I’m sure you’ve already noticed, but ASH Analytics has a tendency to always arrange any of the graphs by the heaviest usage at the bottom to the lightest at the top. This makes it easier to view for the user. This will be the case for pretty much all the activity graphs, where Load Maps will arrange largest to smallest, left to right.
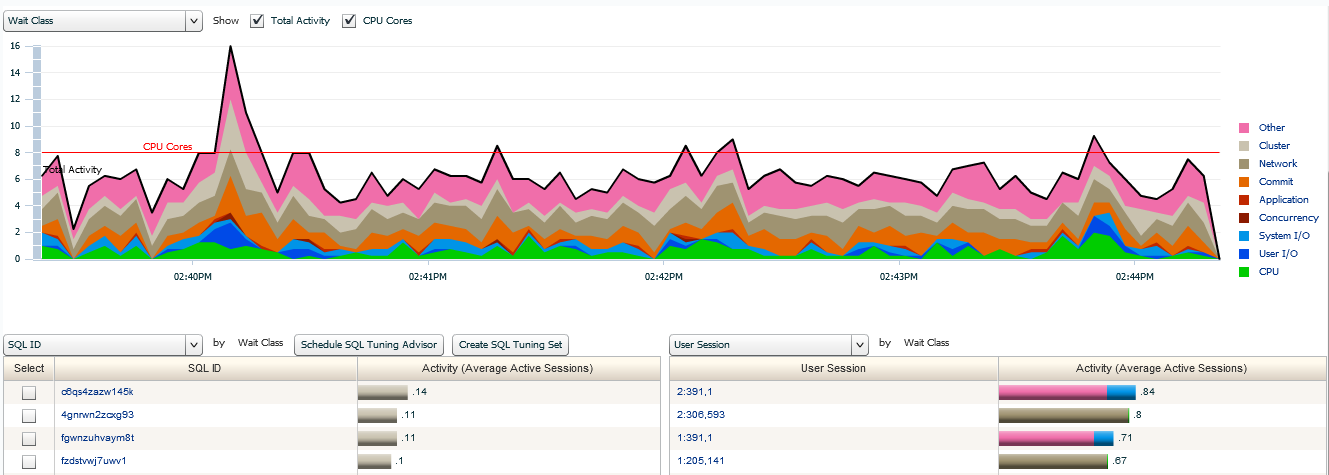
Nope, not much new here- We are still seeing the resource consumption, but as wait events. If we compare it to the standard wait events view, not much different. The reason we would really find value in this is if we had IORM, (IO Resource Manager) enabled. Since we don’t, we’re going to skip it for now and it will get to be part of that blog post in the future… 🙂
Wait Event
when we filter by Wait Event, we get a very different view of our data than we did by Wait class. Note the actual categories that are graph is broken up by, listed down on the right hand side.
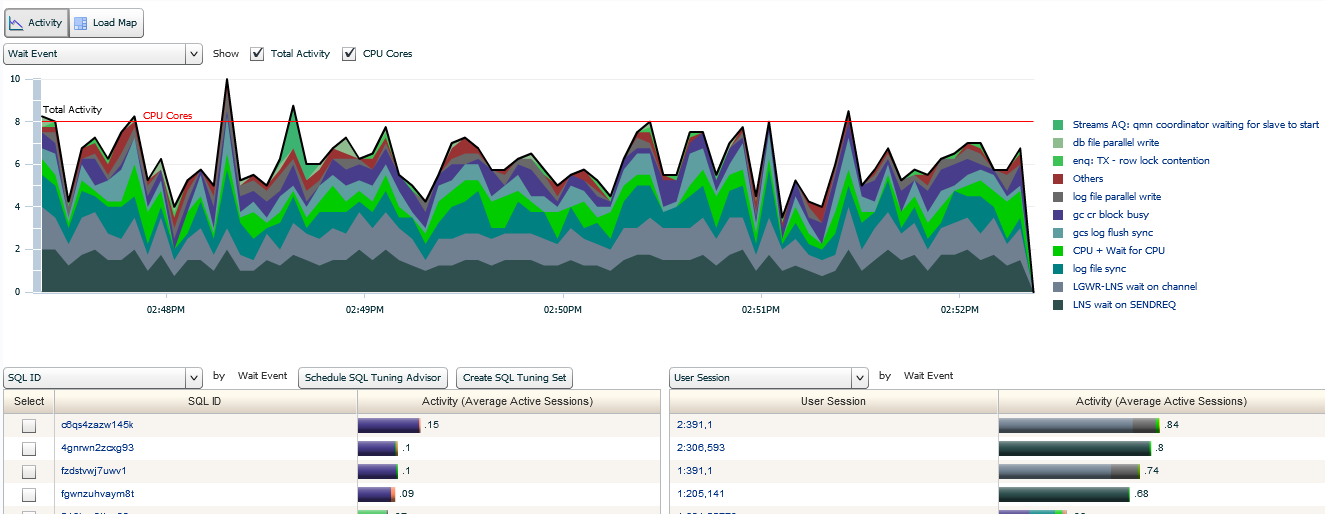
Scanning from the bottom –> up on the right hand side, we can see the largest resource consumption is “LNS Wait on SENDREQ” and the second highest consumer is “LGWR- LNS Wait on Channel”. You are also seeing log file sync and parallel log file write. All of this comes to a clear understanding of what we are dealing with here… Why? This is a dataguard environment and the LNS* type waits are quite common and occur when-
- LGWR writes redo to the online redo log on this primary database (when LGWR SYNC is not used, user commits are acknowledged once this step completes except when the parameter COMMIT NOWAIT is used.
- The Data Guard LNS process on this primary database performs a network send to the Data Guard RFS process on the standby database. For redo write sizes larger than a MB, LNS will issue multiple network sends to the RFS process on the standby.
- LNS posts LGWR that the all the redo has been successfully received and written to disk by the standby, which is a heavy consumer, as well.
On the primary database here is extended resource consumption represented with the “log file parallel write” wait event. We will then note repeated “LNS wait on SENDREQ” wait event, too. You can further divide the “LNS wait on SENDREQ” wait event into network time and RFS I/O time by subtracting the “RFS write” wait event obtained on the standby. These wait events can be assessed on the standby by using multiple queries in the “Data Guard Specific Wait Events” section for a physical standby or by using AWR for a logical standby if you need further proof.
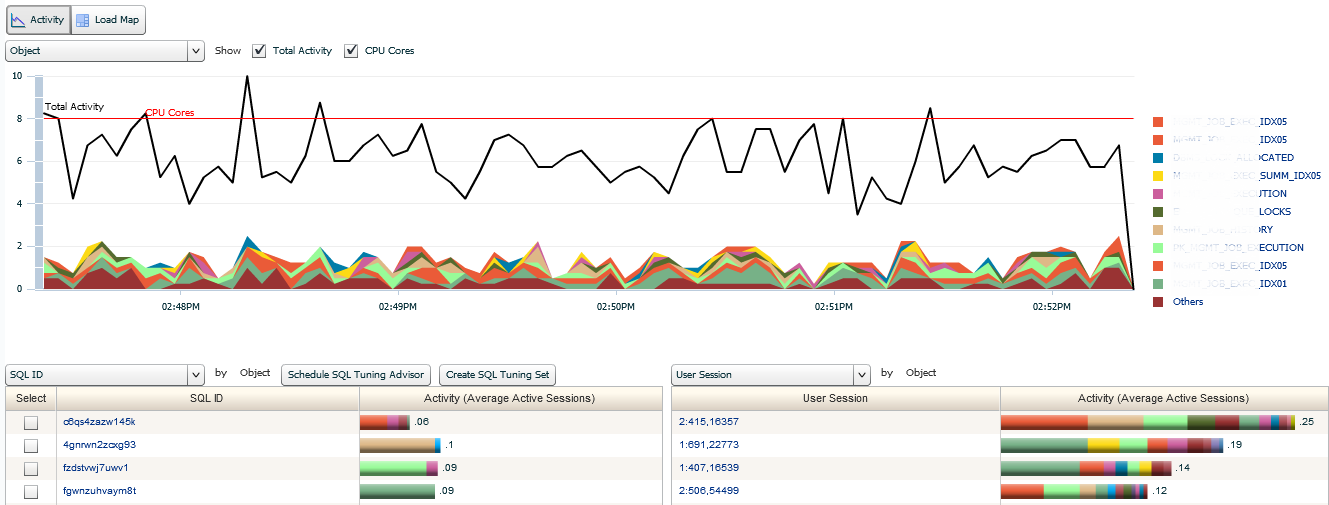
Object
I’ve hidden the exact object names involved in this database, but you’ll note, they weren’t involved in much of the resource consumption anyway. Now on an environment with heavy IO, this would change significantly and you would see a lot more of one or more objects being the focus of this type of graph. This is where having the Top Activity box check marked is helpful, as it clearly shows you that object IO is not much to focus on for this environment. The black mark showing the upper max of activity for any given time in the activity graph gives you a clear line to compare with.
Blocking Session
This is where many of you will become very interested again. We all want to know about blocking sessions and how they may be impacting the resource consumption in our environment. Although there was no *true* impact to production processing, there was some blocking sessions that we could inspect in our current example.
Only sessions that are experiencing some type of bl0cking are displayed in this view. No matter if it’s transaction, (TX- Tran Lock contention or TM- DML enqueue contention , etc.) or UL, (user defined) these sessions will be shown in this graph.
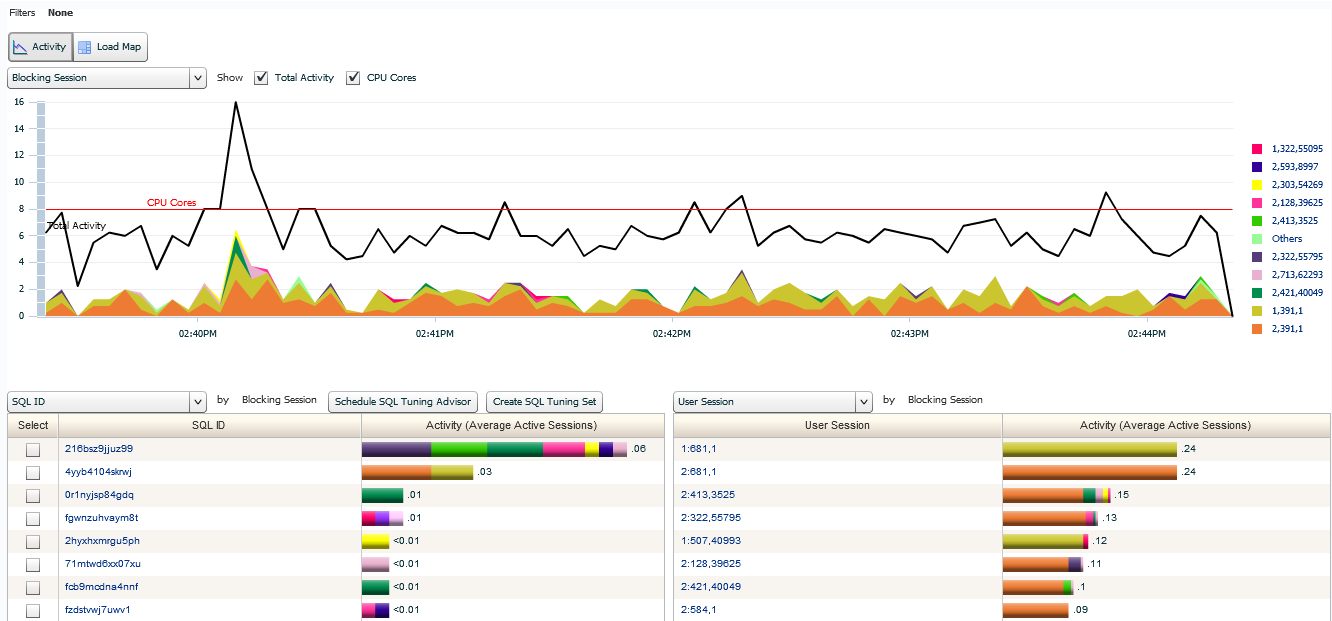
I’ve included the bottom portion of the ASH Analytics section so you’re able to see the SQL_ID’s involved in the sessions and then to the right, you can also view the session information, displayed by Instance ID, (for RAC) session ID, (sid) and serial number, (serial#).
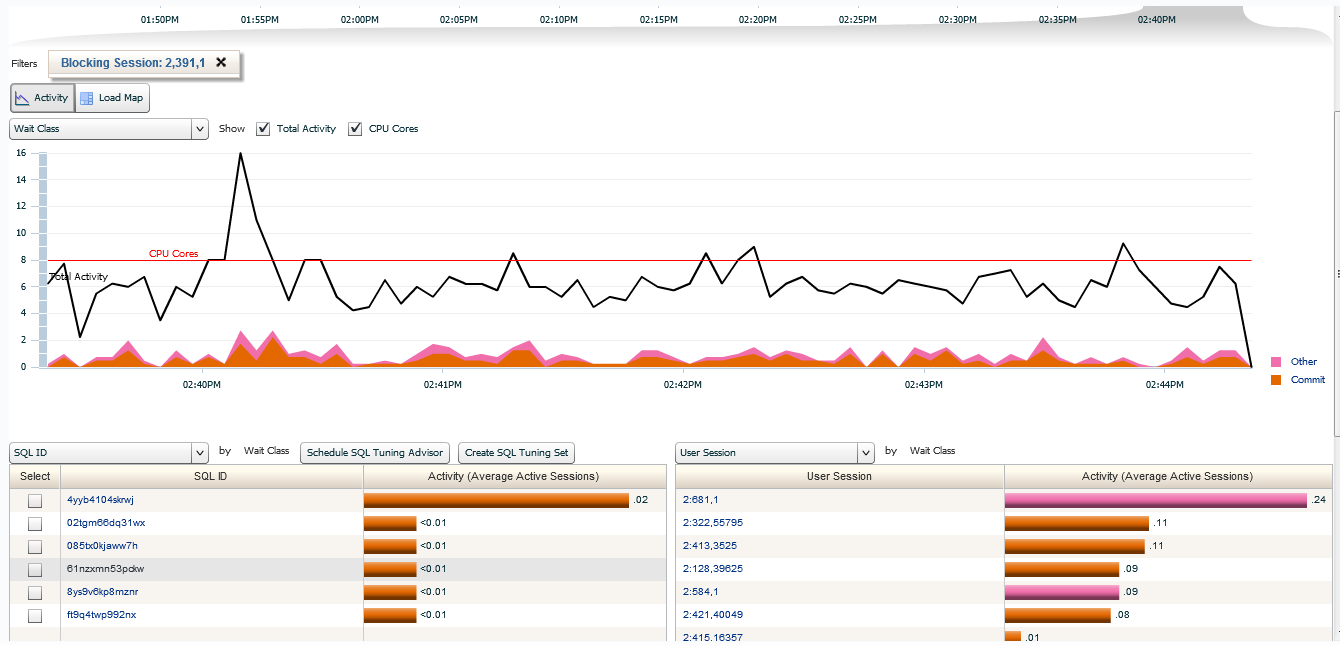
You can then click on a session in the lower section, which will filter the ASH graph by the session and the wait class to give you another view, demonstrating in our example that we are waiting on a commit(s) and then our favorite wait, “other”…. 🙂
What’s helpful, is that the SQL_ID is clearly shown on the left and you’re able to click on any of these, (although I’d highly recommend clicking on the top one that is 5 times the concern vs. the others. :))
This completes the review of the Resource Consumption Menu for the ASH Analytics Activity Page. We’ll continue on in Part III later this week!
