This is the first of many posts I’ll do where we take a particular issue and trouble-shoot. I’ll go through multiple scenarios to show the common steps to take via the Enterprise Manager 12c from discovery to identification to research to explanation.
This blog will use the following features:
- ASH Analytics
- SQL Details
- ASH Report
The first thing we need is an issue-
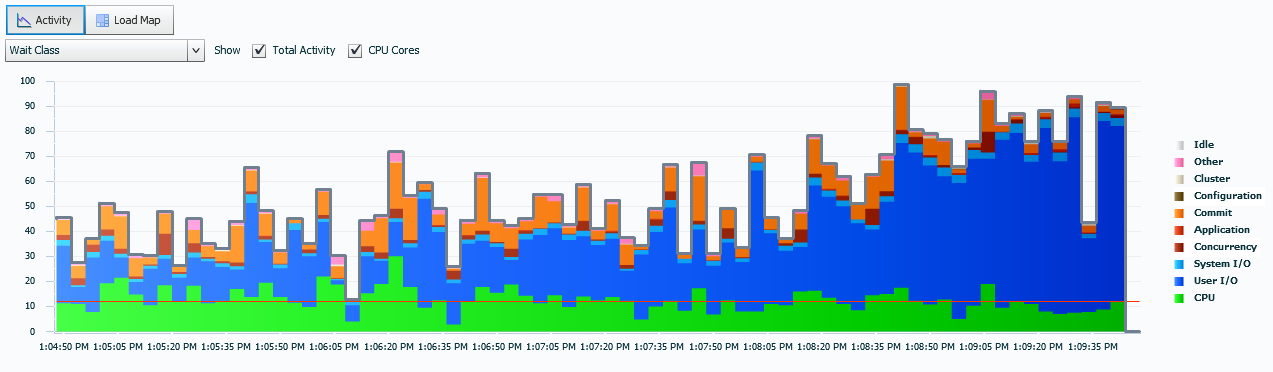
Note the CPU red line- the IO is considerably over that and quite a lot of IO, along with Commit and Concurrency waits. We’ll start with this as our issue that we can see, has quickly escalated over our timeline, (15 minutes was requested from the view…)
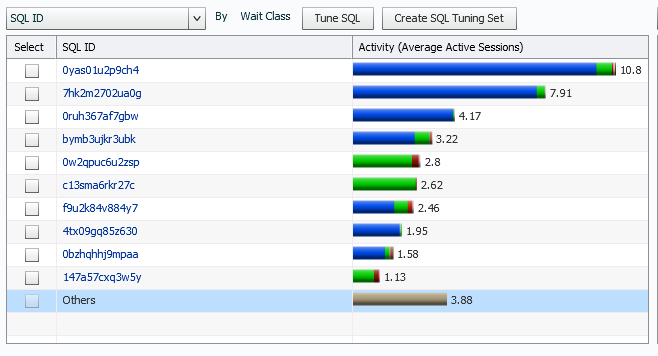
Scanning down to the Top SQL, (by default) we can then see that this IO pressure is primarily caused by two-three SQL_ID during the timeline:
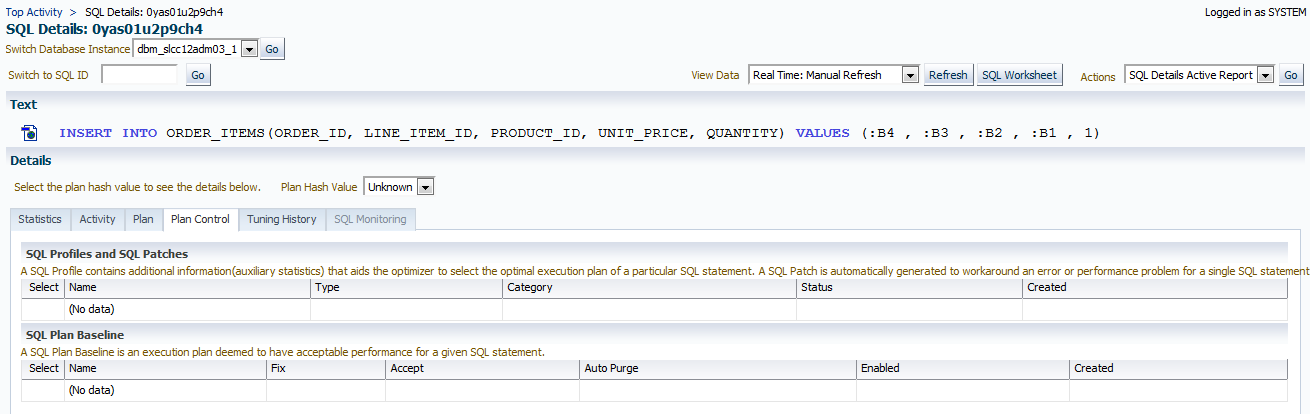
We can click on the first SQL_ID and display the insert statement. We also note the escalation from 1pm to 1:15pm in the Statistics tab that shows the active sessions.
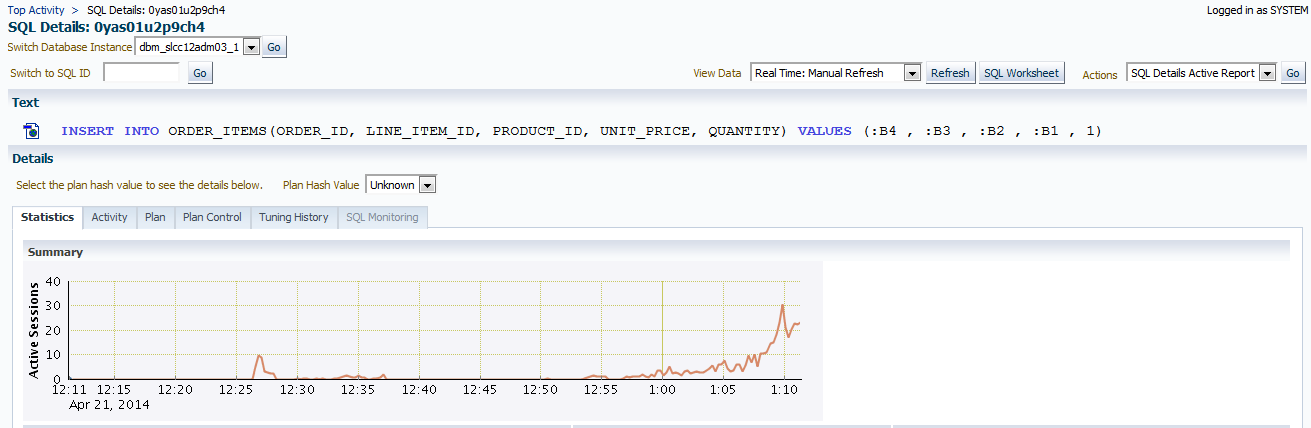
So I know a few of you are asking, “Why isn’t there any Plan Hash Value? If it is a simple insert, with no subquery, etc. then would it have a Plan Hash Value? Think about that as we inspect the next tab, Activity.
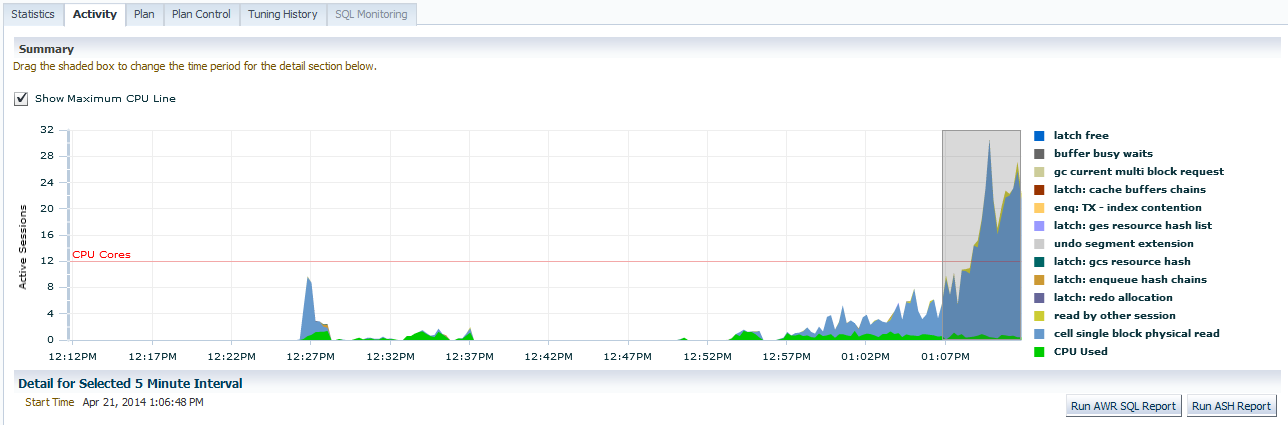
We are now inspecting just the wait events connected with THIS SQL_ID and the sessions that are involved with it. On the right, we can quickly see that there is a huge percentage of cell single block physical read waits involved with this insert. What does that tell you about the hardware that the insert is running on? Yes, it’s part of an Exadata environment.
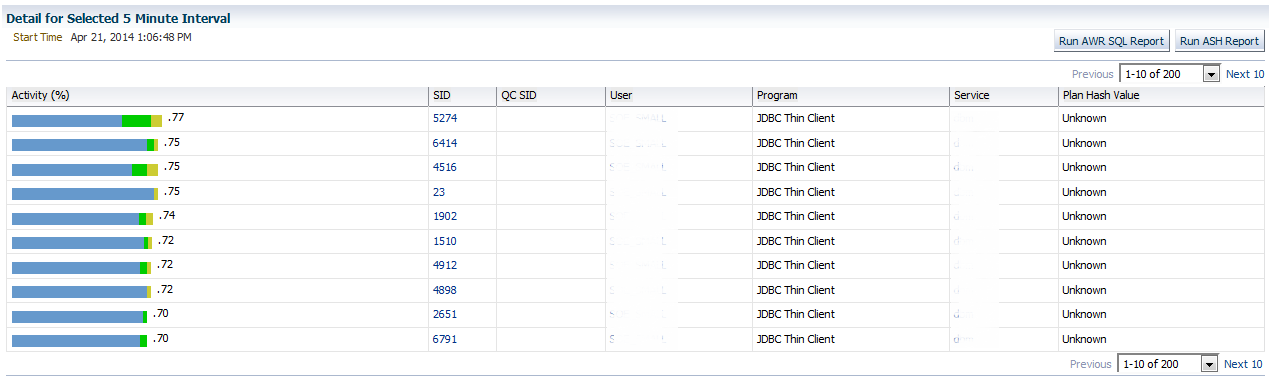
Scrolling down allows us to view the sessions involved in this timeline. This is not just the sessions for the 15 minutes of escalation we are interested in. These are ALL the sessions in the timeline shown above. We can view from the top, .77% of the activity for the first one and note that it decreases as we go through the list. Also notice that it’s 1-10 of 200 sessions total that have been captured during the total timeline. We already know a majority of them are part of our escalation in IO on the system.
Inspecting the last 10 helps us see the decrease in IO resources as concurrency waits increased-
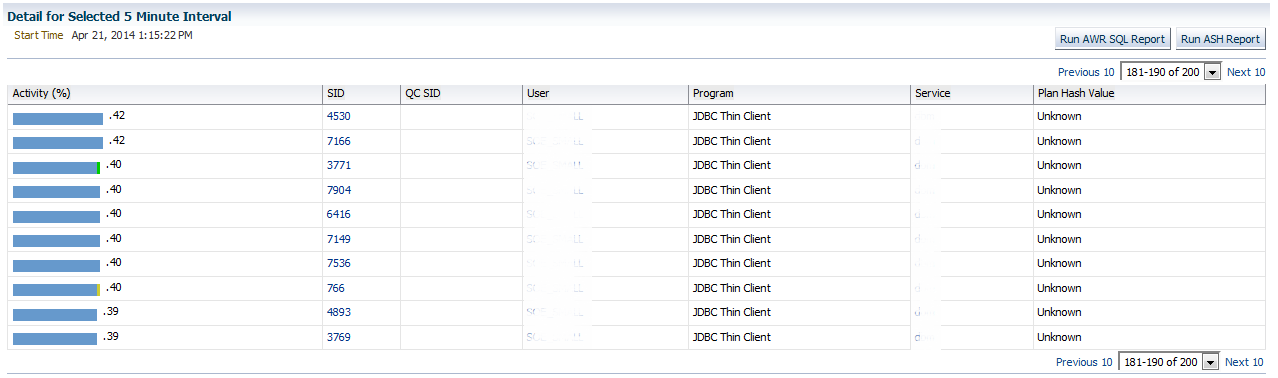
We are down to .39% by the time we get to the 200th session captured in this timeline. Now getting back to our “Should we have a plan hash value for our insert statement?” question. No, we shouldn’t and there isn’t a plan, nor is there plan control that will be found for this simple insert. This is verified when you inspect the Plan and Plan Control tabs for this SQL_ID.
We then can look at the Tuning History.
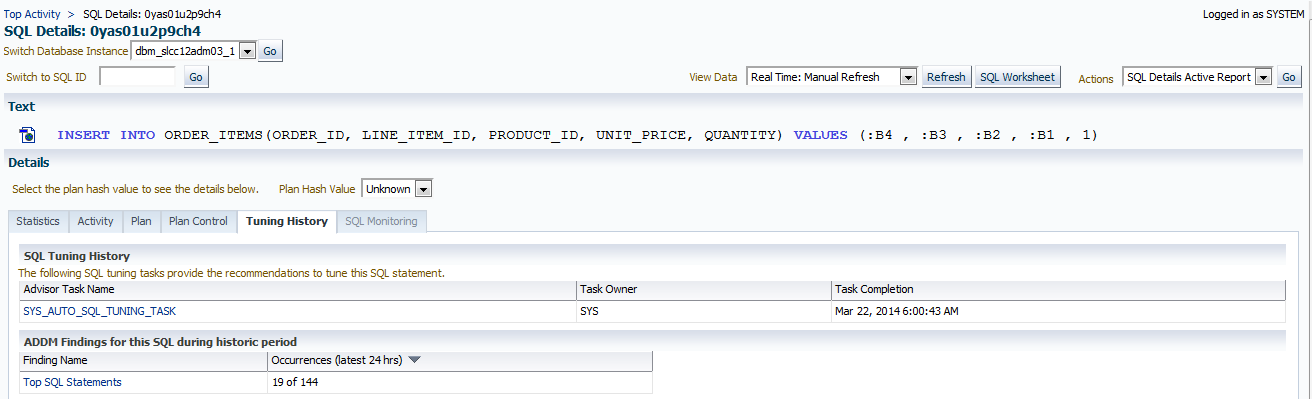
You might wonder how could it be that this insert, that doesn’t have a plan or plan hash value is found in the tuning task? If it is a top SQL that is deemed an impact to performance, then it will show up here. There is no escape for this insert.
At this time, we can see that we are looking at a concurrency issue that is not coming from a user or from a specific session in any way. So the next step is to get a clearer look at the 5+ minutes that lead up to the heavy IO to see what is really going on and eliminate assumptions.
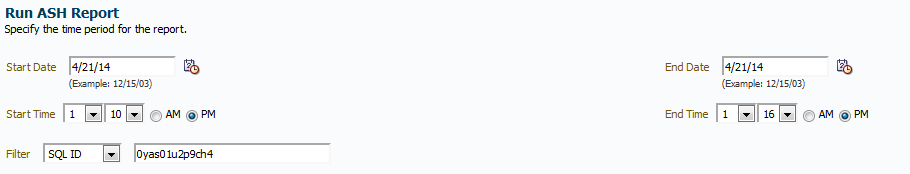
I simply click on “Run ASH Report” in the SQL Details window, change the times to 1:10pm –> 1:16pm and notice that we are focused on this SQL_ID right still.
The report shows the standard header and high level info, but then once you dig in, you’ll see the top events:
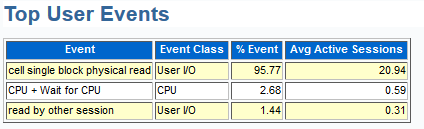
We see that yes, it is almost 96% of the activity with an average of 21 active sessions running at a given time.
If you were to have traced this session, you’d see something similar to the following in the trace file to represent the data in the first three lines that we now see in the ASH report:
WAIT #3: nam='cell single block physical read' ela= 945 cellhash#=3983857215 diskhash#=3558547146 bytes=8192
obj#=12894 tim=1912764532115123
WAIT #3: nam='cell single block physical read' ela= 483 cellhash#=1017296094 diskhash#=1180032005 bytes=8192
obj#=46129 tim=1213898462783761
WAIT #3: nam='cell single block physical read' ela= 697 cellhash#=1017296094 diskhash#=3896957901 bytes=8192
obj#=47883 tim=1158963811267355
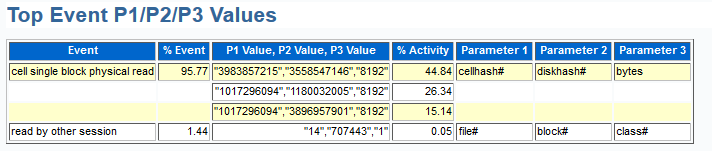
Note that there are THREE cell single block physical reads for the insert event. Why would we see this? This is the one question to the readers of this blog- What would cause the single block physical reads on these three indexes?

It’s not the table we are having an issue with but the indexes that are on the table. Three indexes show up very clearly in our Top DB Objects section showing our wait event, cell single block physical read. The ASH report gained this information from the obj#, just like you see in the trace file info in red up above that I displayed for you. For each of those entries shown, a very similar percentage of the event is displayed farther up in the Top Event P1/P2/P3 Values.
So from here, I think we’ve inspected the SQL_ID pretty fully and we know why the problem is occurring. There are three indexes that require a scan
The final answer we want is why is this heavy load occurring? Well, ASH answers this for us, too-
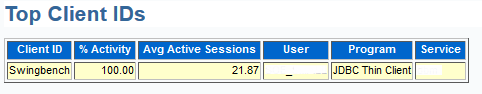
Yeah, someone is TRYING to put a heavy load on the database with Swingbench and the active average sessions matches our active average sessions overall. We’ll leave it as is- no one wants to be responsible for killing someone’s load test… 🙂