There are a number of Verification Utilities for Enterprise Manager 12c, (EM12c) and I’ve written about them before, but today I’m going to start on the Repository Verification Utility, (REPVFY). This will be an ongoing series, as there are so many valuable features rolled into the utility and new ones that will be added as new patches and releases happen.
For this post, I’m going to be reviewing a level 2 diagnostics report from a new repository database. This is going to offer us all kinds of valuable data about the environment and should be considered by any EM12c administrator when doing a health check of their EM environment.
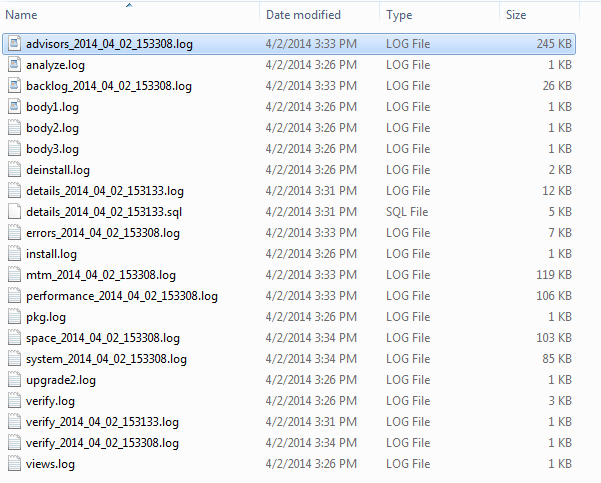
Inspecting the files from the output, you’ll note that they don’t require a lot of space, even when unzipped and this allows the admin to retain historical information about the EM12c environment.
Note that the files are broken up by type of review and marked with the timestamp for many of these files.
For this first blog post, I’m going to jump right into the first log alphabetically, the advisors log file, which as you might guess, is advising on performance. The interesting thing is as small as this file is, it is actually comprised of a number of reports that one would be surprised how much work to run all of it manually.
The Advisors Log is comprised of the following reports:
- ADDM Report
- Space Advisor Report
- ASH Report
- AWR Report
- SGA Resizing Report
The report then ends with the CBO Repository information before closing up this one of many log files generated by a simple and single execution from the command line. I would definitely read through to this final section to understand the stats collection in the EM Repository database a bit more clearly, as I do touch on it in this post.
Advisor Log Header
When viewing the log file, the first thing it tells you is where the source SQL for the report comes from. This is helpful if you want to inspect the SQL used.
The next is information about the release versions and such involved. This is standard for most of the log files in the repvfy output:
COMPONENT INFO
------------------ ----------------------------------------
EMDIAG Version 2014.0318
Repository Version 12.1.0.3.0
Database Version 11.2.0.3.0
Test Version 2014.0402
Repository Type CENTRAL
The next sections of the report will go over the repository database and report on the type of database, (single instance or RAC, protected, version, etc.) and other pertinent information. This is multiple query output I would like to see rewritten and compiled into one result set, but it’s still good to have this data, no matter what the output.
We then jump into SGA information and init/sp parameters. What surprised me is that next section was dedicated to System statistics and the OS stats data. This data is often only updated when a change to hardware has been made or if parallel is implemented and it’s set up in an upper level of the report indicating that the author of the report found this information valuable to the performance of the repository database, (not agreeing or disagreeing here, found it more curious than anything as I find it can be important in large databases, which the EM repository rarely is…)
--- Database OS statistics
SNAME PNAME PVAL1 PVAL2
------------------------------ ------------------------------ ---------- ----------------------------------------
SYSSTATS_INFO STATUS COMPLETED
SYSSTATS_INFO DSTART 03-29-2014 02:00
SYSSTATS_INFO DSTOP 03-29-2014 02:00
SYSSTATS_INFO FLAGS 1
SYSSTATS_MAIN CPUSPEEDNW 1405
SYSSTATS_MAIN IOSEEKTIM 18
SYSSTATS_MAIN IOTFRSPEED 4096
ADDM Report
Next the utility runs an ADDM report for the previous hour’s snapshot. Now ADDM reports rarely receive a lot of love from DBAs. It’s not the top info it includes or the findings, it’s the recommendations that commonly leave them less than thrilled. How often do we read one that doesn’t recommend some type of hardware solution to a problem that we know with hardware applied, will only rear its ugly head again a few months to a year later? If there was one recommendation I could make to this valuable report is to take those recommendations out and I think you’d see a lot more DBAs embracing ADDM reports.
The report for the repository database is true to form, only this time it’s Oracle’s objects being offered hardware solutions!
ECMAM_PK 0 0 0 0
Move object SYSMAN.ECMAM_PK to flash storage, estimated I/O wait reduction is 10 millisec
EM_CS_SCORE_HIST 0 0 0 0
Move object SYSMAN.EM_CS_SCORE_HIST partition 2014-03-25 00:00 to flash storage, estimated I/O wait reduction is 125 millisec.
EM_EVENT_MSGS_PK 0 0 0 0
Move object SYSMAN.EM_EVENT_MSGS_PK partition OPEN to flash storage, estimated I/O wait reduction is 5 millisec.
EM_METRIC_KEY_GUID_IDX 0 0 0 0
Move object SYSMAN.EM_METRIC_KEY_GUID_IDX to flash storage, estimated I/O wait reduction is 336 millisec
Now who is to say that a savings of 10-336ms is worth the cost of flash storage? I’m not, but this is just more proof to me that the recommendations section is still not where most DBAs would like to see the ADDM report.
Further sections of the report do live up to the hype and offer similar value to what we see in AWR for the EM repository database:
Top Background Events DB/Inst: OEM/OEM (Apr 02 14:00 to 15:00)
Avg Active
Event Event Class % Activity Sessions
----------------------------------- --------------- ---------- ----------
os thread startup Concurrency 47.91 0.03
CPU + Wait for CPU CPU 9.77 0.01
To clearly show that it is Concurrency that is causing the OS Thread Startup % of activity is important. This helps keep the administrator on the right track if they were to investigate the wait event.
The following section goes through the code and action involved in the last hour’s ADDM activity. You can see if there is anything causing an issue, but as we can see in our repository, not much of anything- it’s nice an quiet…. J
Top Service/Module DB/Inst: OEM/OEM (Apr 02 14:00 to 15:00)
Service Module % Activity Action % Action
-------------- ------------------------ ---------- ------------------ ----------
SYS$USERS DBMS_SCHEDULER 8.84 EM_REPOS_SEV_EVAL 2.79
EM_SYSTEM_MEMBER_S 1.40
EM_TASK_WORKER_3 1.40
MGMT_COLLECTION.COLLECTI 8.37 Task:881 Repositor 4.19
Task:37 Performanc 1.40
OEM.PbsSystemPool 6.51 PingHeartBeatWork: 2.33
LoaderWorker 1.40
GATHER_SYSMAN_STATS 2.33 UNNAMED 0.93
Next it reports on sessions and then on percentage of activity was allocated to different SQL types and the percentage allocated to different phases of the SQL, (what percentage of activity was consumed by hard parsing vs. SQL or PL/SQL execution….)
Just like an ADDM report, the top SQL statements, including SQL_ID and percentage of activity is reported:
Sampled #
SQL ID Planhash of Executions % Activity
----------------------- -------------------- -------------------- --------------
Event % Event Top Row Source % RwSrc
------------------------------ ------- --------------------------------- -------
7mqykaw68fkhb 2691428406 6 4.19
CPU + Wait for CPU 4.19 TABLE ACCESS - FULL 2.79
SELECT COUNT(*) FROM DBA_SCHEDULER_JOB_RUN_DETAILS WHERE OWNER = MGMT_USER.GET_R
EPOSITORY_OWNER AND JOB_NAME = UPPER(:B3 ) AND STATUS = 'SUCCEEDED' AND ACTUAL_S
TART_DATE >= :B2 AND ACTUAL_START_DATE < :B1
The report will go through this for top row source, literals, actions, etc. It will then jump into the top procedures that were called:
PLSQL Entry Subprogram % Activity
----------------------------------------------------------------- ----------
PLSQL Current Subprogram % Current
----------------------------------------------------------------- ----------
SYSMAN.EM_TASK.WORKER 8.84
SQL 6.05
SYS.DBMS_ASSERT.SIMPLE_SQL_NAME 1.40
SYSMAN.EM_PING.RECORD_BATCH_HEARTBEAT 3.26
SQL 1.86
This can help you quickly find what procedures to search for the SQL shown in the sections before.
Blocking sessions, top sessions and top latches are just some of the areas, just as in a standard AWR report that are covered, but this is all for the EM repository database!
This section of the report is finished up with information about the AWR retention so if you need to go back and investigate further, you know up front what you have to work with in the AWR, (Automatic Workload Repository.)
--- AWR retention
INTERVAL RETENTION
---------- ----------
60 11520
No, the report is not even close to being finished for the Advisor log at this point. It jumps promptly into a workload report to give you a good view of what kind of processing this repository database is handling daily.
FULL AWR Report
Just as with a standard AWR report, the basic information about the repository for the previous hour is included with the Advisor log. Keep this in mind as you review this report. If this is not a heavy use time for your EM repository database, the data may not be as valid as if we were looking at a larger timeframe.
If you are more comfortable with statspack or AWR reports, then you will want to spend more time here than the ADDM section, but both provide their own view on the data provided.
The IO Statistics by Function Summary
Reads: Reqs Data Writes: Reqs Data Waits: Avg
Function Name Data per sec per sec Data per sec per sec Count Tm(ms)
--------------- ------- ------- ------- ------- ------- ------- ------- -------
Buffer Cache Re 818M 2.1 .227007 0M 0.0 0M 7628 0.1
Others 62M 1.1 .017205 44M 0.8 .012210 6643 0.8
DBWR 0M 0.0 0M 94M 1.7 .026086 5938 0.5
LGWR 1M 0.0 .000277 40M 2.2 .011100 15.3K 0.5
Direct Reads 2M 0.0 .000555 0M 0.0 0M 17 0.0
Direct Writes 0M 0.0 0M 1M 0.0 .000277 11 0.7
TOTAL: 883M 3.2 .245045 179M 4.6 .049675 35.5K 0.5
------------------------------------------------------------
Direct Reads
2M 0.0 .000555 0M 0.0 0M 0 N/A
Direct Reads (Data File)
2M 0.0 .000555 0M 0.0 0M 0 N/A
Direct Writes
0M 0.0 0M 1M 0.0 .000277 0 N/A
Direct Writes (Data File)
0M 0.0 0M 1M 0.0 .000277 0 N/A
TOTAL:
883M 3.2 .245045 178M 4.6 .049397 11.6K 0.1
------------------------------------------------------------
Enqueue Activity
Enqueue Type (Request Reason)
------------------------------------------------------------------------------
Requests Succ Gets Failed Gets Waits Wt Time (s) Av Wt Time(ms)
------------ ------------ ----------- ----------- ------------ --------------
JS-Job Scheduler (queue lock)
25,724 25,724 0 59 0 1.19
KO-Multiple Object Checkpoint (fast object checkpoint)
30 30 0 3 0 6.67
SQ-Sequence Cache
75 75 0 3 0 3.33
------------------------------------------------------------
Also spend some time inspecting the Latch and Mutex sections. These are areas of memory that many Oracle databases are experiencing challenges with from time to time. These allocations in memory are good to understand and even the EM repository database experiences issues with both when concurrency is commonly involved.
I’ve been a long time proponent of the Segment reporting section in the AWR. This report can often seal up remaining questions that DBAs have after seeing the top SQL by elapsed time that were answered upon viewing the execution plan.
Segments by Physical Reads
-> Total Physical Reads: 105,015
-> Captured Segments account for 98.1% of Total
Tablespace Subobject Obj. Physical
Owner Name Object Name Name Type Reads %Total
---------- ---------- -------------------- ---------- ----- ------------ -------
SYS SYSAUX SCHEDULER$_JOB_RUN_D TABLE 59,463 56.62
SYS SYSAUX SCHEDULER$_EVENT_LOG TABLE 43,048 40.99
SYS SYSTEM OBJ$ TABLE 266 .25
SYS SYSAUX I_WRI$_OPTSTAT_H_OBJ INDEX 107 .10
SYSMAN MGMT_TABLE EM_EV_METRIC_ALERT P201404 TABLE 47 .04
There will be sections for logical, physical and unoptimized reads, along with row locks, table scans, writes and even ITL waits. The report continues with library cache and all variations of memory information. This is an area that I feel more than an hour could be beneficial for the REPVFY utility output and a future enhancement might be to follow with an argument for time frame of snapshots to be utilized for the report.
SGA Resizing Report
This report provides not just SGA information, but also PGA and caches. It starts out by giving the reader a view of any specially sized buffer caches and each of the pools, (large, java, ASM, etc.)
-- SGA Dynamic Components
-- Cache: D:DEFAULT, K:KEEP, R:RECYCLE
-- Mode: DEF:DEFerred mode, IMM:IMMediate mode
Last Oper Last
Component Size (M) Type/Mode Operation Time
---------------------- -------- ---------- --------------------
D: 2K buffer cache 0 STATIC
D: 4K buffer cache 0 STATIC
D: 8K buffer cache 0 STATIC
D:16K buffer cache 0 STATIC
D:32K buffer cache 0 STATIC
D:buffer cache 448 INITIALIZI
From there, it steps into resize operations for SGA and then PGA.
-- PGA Resize Operations overview
I# SNAP_TIME PGA_TARGET PGA_ALLOC PROCS AUTO MANUAL
---- -------------------- ---------- --------- -------- ----------- -----------
1 02-APR-2014 15:00:00 493 281 60 0.00 0.00
1 02-APR-2014 14:00:00 493 290 66 0.00 0.00
1 02-APR-2014 13:00:00 493 311 70 0.00 0.00
1 02-APR-2014 12:00:00 493 286 66 0.00 0.00
This part of the report is not held to the 1 hour snapshot as we experience in the ADDM and AWR section of the Advisor log. The data for these sections went back for one week and provided a clear picture of resizing activities for the SGA and PGA.
Repository CBO Report
This section is built out of SQL added to the advisor.sql in the REPVFY utility. Its only found in the Advisor report and is essential to understanding specific information in terms to CBO, (cost based optimizer) information to the repository database. To think of this as schema specific is more in line with the value provided from the information.
If you remember back to when you installed the EM12c on the repository database, it has you disable the automated dbms_stats job? This is now providing you with the internal stats job information that provides the correct statistical information to the CBO-
TABLE_NAME INCREMENTAL GRANULARITY STALE_PCT
-------------------------------- ----------- --------------- ---------
ADP_METRIC0 TRUE
ADP_METRIC1 TRUE
ADP_METRIC2 TRUE
EMCT_CBA_CHARGE_1DAY TRUE
EMCT_CBA_CHARGE_1HOUR TRUE
EM_EVENTS_INCIDENT TRUE 10
EM_EVENT_ANNOTATIONS TRUE 10
EM_EVENT_CONTEXT TRUE
EM_EVENT_MSGS TRUE 10
EM_EVENT_PROCESSING_STATE TRUE
EM_EVENT_RAW TRUE 10
EM_EVENT_SEQUENCES TRUE 10
EM_EVENT_SEQ_STATE 10
EM_METRIC_VALUES AUTO 10
EM_METRIC_VALUES_DAILY AUTO 10
EM_METRIC_VALUES_HOURLY AUTO 10
As the repository database scales, the EM stats feature can be scaled to support more extensive statistics information as well. I am cautious to say this and will say it with a grain of salt, but it backs up my experience that 95% of databases are served successfully with the current automated stats job, but that there are types that require a DBA with knowledge of the schema, data and code to ensure the CBO has what it needs to perform efficiently. The biggest challenge is that there aren’t a lot of DBAs with that knowledge or time to invest in this task, (I know, I did this in two companies and it must be a true passion.) EM12c has removed this challenge from the DBAs plate by setting up the one-off stats collection requirement for them as part of the repository installation.
They’ve enhanced that in the REPVFY by having a utility step that checks to see what is currently in place and then the ability to review it as part of this output.
TABLE_NAME RUN_TYPE INCREMENTAL GRANULARITY STALE_PCT
-------------------------------- -------------------------------- ----------- --------------- ---------
EM_EVENTS_INCIDENT DAILY 20
EM_EVENT_ANNOTATIONS DAILY 20
EM_EVENT_MSGS DAILY 20
EM_EVENT_RAW DAILY 20
Curious about when and how long the jobs that do this work run? This is included as well-
[----- CBO statistics gathering log (last 3 days) ---------------------------]
LOG_DATE RUN_TYPE DURATION OBJECTS_ANALYZED OBJECTS_STALE OBJECTS_FILTER VALUE
-------------------- -------------------------------- ---------- ---------------- ------------- -------------- --------------------------------------------------------------------------------
02-APR-2014 14:24:16 PROACTIVE 5 3 69 24 P:1.86:EM_EVENT_ANNOTATIONS;1.13:MGMT_JOB_EXECUTION;.71:EM_EV_METRIC_ALERT;
02-APR-2014 12:24:16 PROACTIVE 9 5 71 24 P:2.47:EM_EVENT_RAW;1.97:EM_EVENT_SEQUENCES;1.34:MGMT_JOB_EXECUTION;.87:EM_EVENT
02-APR-2014 10:24:16 DAILY 123 272 457 D:6.91:EM_JOB_METRICS;5.66:MGMT_SYSTEM_PERFORMANCE_LOG;4.81:MGMT_ARU_PATCH_FIXES
02-APR-2014 08:24:16 PROACTIVE 13 7 74 24
Table stats in the repository? Yep, that’s included, too!
[----- Table statistics -----------------------------------------------------]
TABLE_NAME PARTITION_NAME LAST_ANALYZED NUM_ROWS BLOCKS AVG_ROW_LEN GLO USE STATT STA
-------------------------------- ------------------------------ -------------------- ---------- ---------- ----------- --- --- ----- ---
EM_METRIC_VALUES_DAILY 29-MAR-2014 10:25:19 95257 2040 16 YES NO ALL YES
EM_METRIC_VALUES_HOURLY 01-APR-2014 10:26:49 681018 15820 16 YES NO ALL YES
MGMT_DB_FEATUREUSAGE 02-APR-2014 10:25:13 5713 244 149 YES NO ALL YES
And with all of that, (pages and pages…) we’re done with the first of many reports. I’ll keep to the most essential data in each, but hopefully you’ve learned something you hadn’t known before about the REPVFY utility and I’ll update with the next log report soon!