
EM12c Release 4, Health Overview
As part of the projects I work on at Oracle, it’s often ensuring that those customers that wish to deploy Enterprise Manager, (EM12c) to large environments, have the correct settings and are tuned to offer the best performance from the Oracle Management repository database, weblogic and up to the console URL’s accessed by users. This means that these large environments often receive recommendations from our experts that differ from what EM12c comes “out of the box” with.
For those that aren’t receiving internal Oracle training on what to look for and how to tune EM12c tiers, there are some new features in release 4 that should be checked out by anyone using EM12c.
EM12c Health Overview
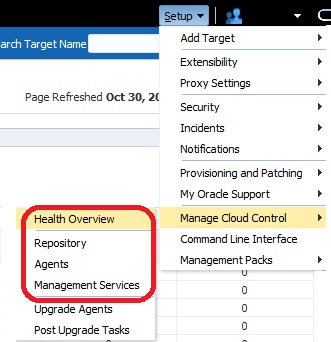
The Health Overview is accessible via the Setup menu, (right side of Console), Manage Cloud Control and Health Overview.
We’ll go over each of these new monitoring tools, but the Health Overview includes valuable information about the health of both the Oracle Management Repository, (OMR) and the Oracle Management Service, (OMS).
The overview page breaks down into easy to understand sections. The first is basic information and workload on the OMS:
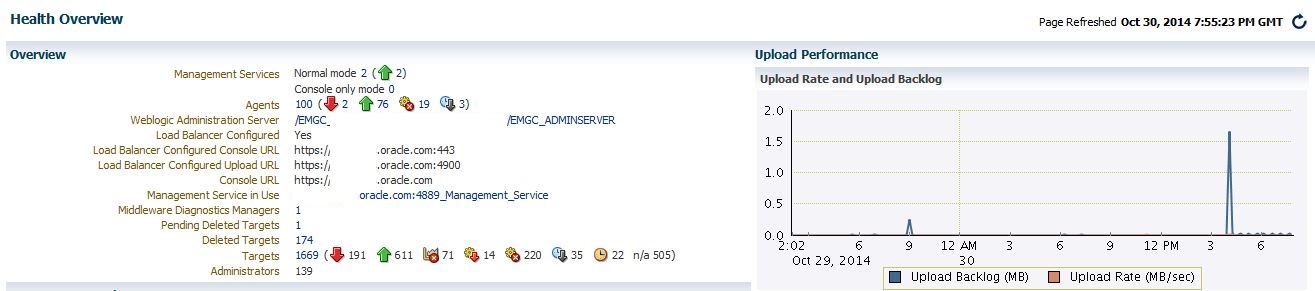
From here you can see all pertinent, high level information about the OMS/OMR, including OMS information, the number of agents, including status counts on availability and if a load balancer is used in the EM12c configuration. Important target status availability is posted, along with how many administrators have been given access to the EM console.
Below this we can view the backlog graph on the right hand side of the page:
That right hand graph is important since along with the upload rate, you can see if there is a consistent backlog of XML files to be uploaded and that can signal performance trouble. A backlog can cause problems, as this beings there is a backlog for the loader can delay receipt of critical alerts and information about a target. If the backlog becomes too extensive, an agent can reach a threshold on how many files it can handle backlogged and stop collecting, which is a significant issue. It’s important that if serious backlog issues are noted, tuning options to deter from them, (like add a load balancer to assist in managing the workload or a second OMS.)
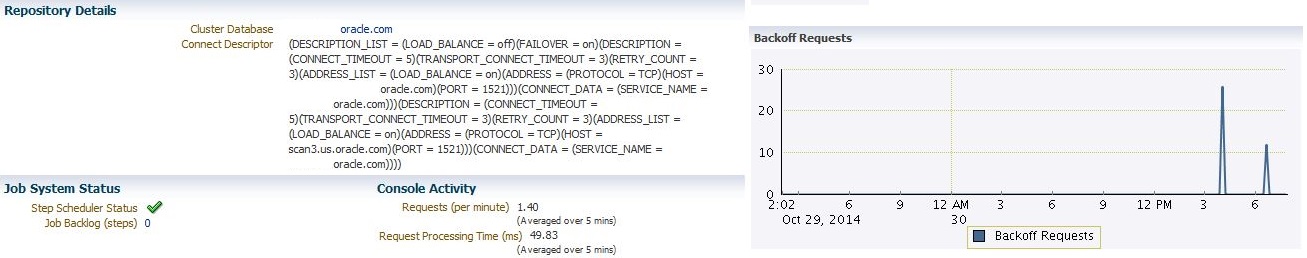
Repository Details
The next section includes connection information, which also has the service name, the database name and database type, the port and job system status. On the right is a graph showing if any backoff requests have been sent. These occur when the OMS is busy processing an XML upload and requests the agent to hold off on sending anymore files until it has finished.
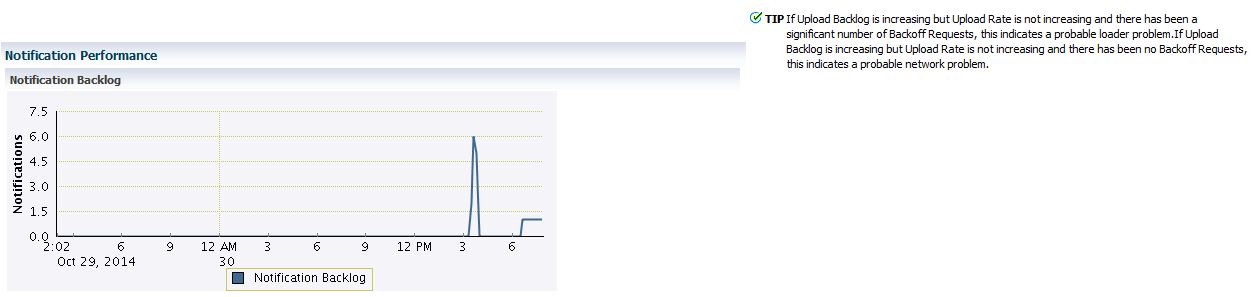
Notification Information
Scanning down from the backoff graph in the Health Overview displays the Notification backlog graph. Knowing how backlogged your time-sensitive notifications are performing is crucial when someone asks if there is anyway to know why one of the notifications weren’t received in a timely manner and you can quickly assess if it is an issue with EM12c or if the problem resides elsewhere.
Alerts
The last section in the health overview covers incident management. You can easily see if there are any Metric Collection Errors, (corresponding this to the backlog data above if necessary), access related Metric Errors and Related Alerts.
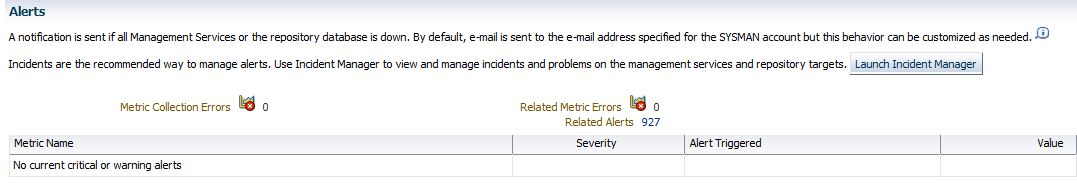
You also can choose to launch the Incident Manager from the Health Overview console if you wish to get more details about all incidents currently in the queue. This view is really to give you a very high level account of what incidents are currently open and related alerts and metric errors. Use that button to launch the Incident Manager if you wish to see what the alerts are all about.
We’ll dig into the deeper diagnostic data offered in EM12c, release 4 for the OMR, OMS and Agents in subsequent posts, so until next time!
Comments are closed.