
Distributed Transactions and EM12c Page Performance
While presenting at HotSos in Dallas, Tx, an attendee, (thank you Wenju! :)) asked how page performance issues could be identified when the call was being made remotely and not from the Oracle Management Repository, (OMR) using the Page Performance console within Cloud Control.
This is a very good question and although not straight forward, I would like to demonstrate what is available to assist in answering the challenge.
First, I have to add that the answer is provided using release 12.1.0.4 of the Enterprise Manager 12c, so if you are still running an earlier version, your results may not render as successful an outcome, but I will also provide you with a command line option to help those of you on those earlier releases, too.
Page Performance Console
The Page Performance Console is accessed once you’ve entered the Cloud Control Management feature from the Setup –> Manage Cloud Control –> Health Overview. After entering the Health Overview, at the left, top menu, click on OMS and Repository –> Monitoring –> Page Performance. There are three tabs available in this console and using the second tab, Page Level Performance, you will view the list of pages that are experiencing the longest waits, in descending order.
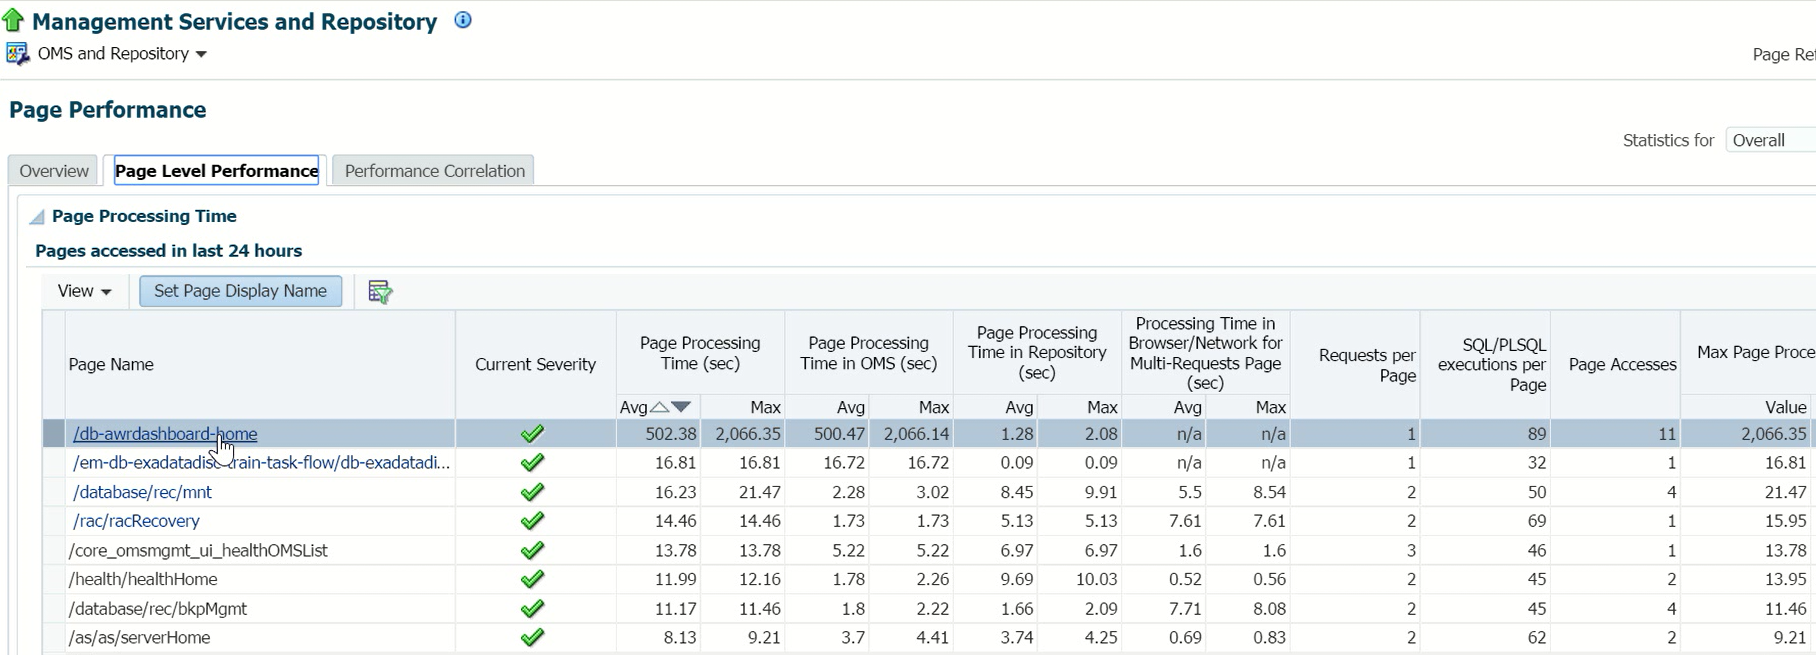
Using the first one in the list, we note that this is the AWR Warehouse. The calls are made to a remote database, (the AWR Repository is not stored in the same database as the Oracle Management Repository, so of course, the calls are 90%+ remote…) so it’s an excellent choice to use as an example.
Clicking on the link for the page, I’m brought to the Page Performance Report that has all the details on the performance waits for the console page. As I’ve been a heavy user of this, it’s no wonder if it showing up as the top in the page processing time.
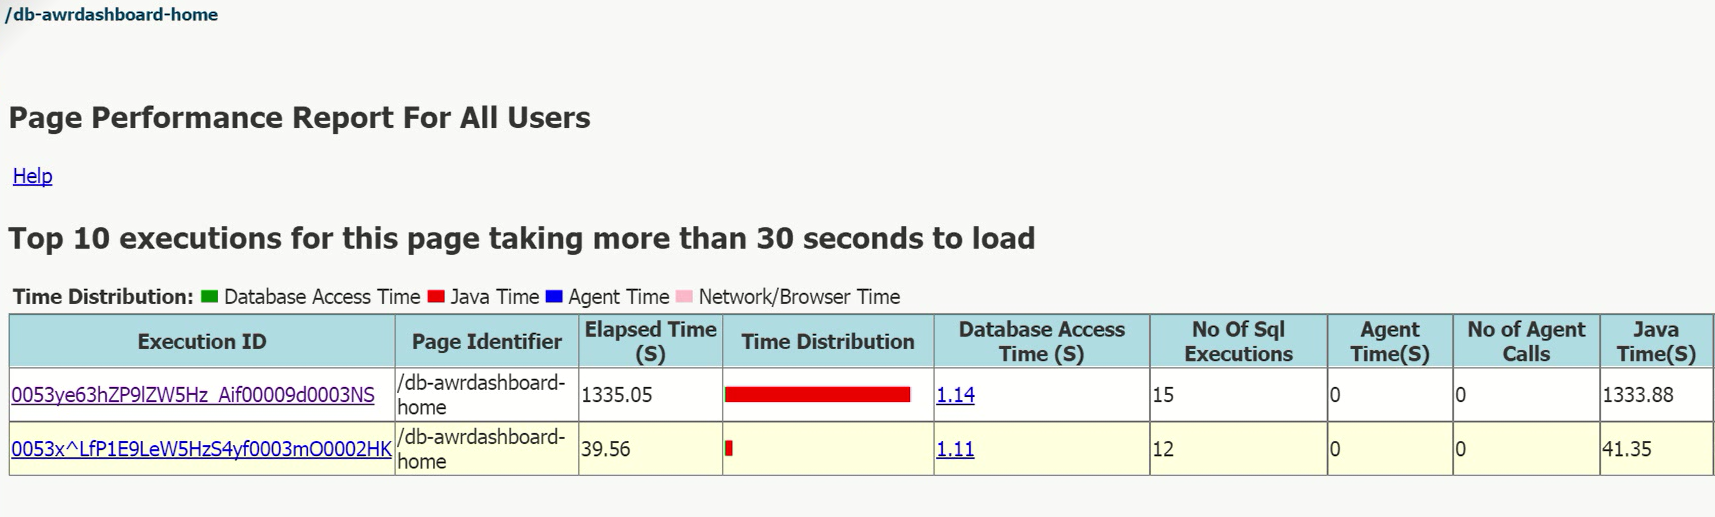
The initial section clearly shows us how much of the performance issue is derived from java waits. Knowing that this is the case, you would think that we can just bypass this, but to have the data verifying what the culprit is for waits is essential for a DBA. We should never assume or guess when it comes to performance and this is just one more valuable feature of EM12c that eliminates that from the demanding challenges from users that are posed to you each day. To make it easier to understand the above section, if there were additional time distribution for database, agent or network/browser time, it would be displayed similarly to the top sessions and top SQL in the Top Activity:
When you are viewing the data in the Page Performance report, the translation from Top Activity for the DBA is:
Time Distribution = Activity(%)
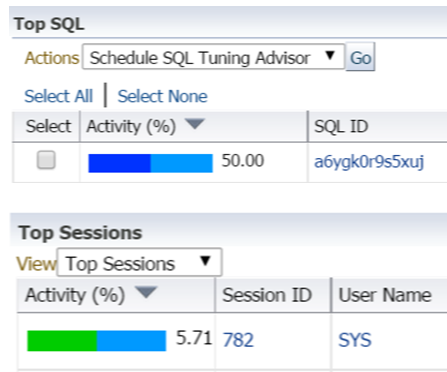
Even though the database calls are completely insignificant, the data is still provided as part of the report. Just saying the remote calls are not enough, we need to see why they were deemed insignificant. If we want to see how our distributed (aka remote) calls are contributing to the time consumed by the total process, then all we have to do is scan down in the Top SQL part of the report to investigate.

Note that no SQL_IDs are displayed, even though these are all queries. The reason is that the OMR is not able to pull these remote calls in the AWR Warehouse that are being queried by Cloud Control. What is displayed is the time CONSUMED by each of the executions till the results are returned to the console and no Top SQL is listed as nothing was over 10ms. As I’ve stated, there is incredible value in knowing that database time is still not the main consumer of the remote calls. The second valuable information is displayed to the very right of the image, which are the remote session IDs, which can be used if you wished to investigate this via EM12c in the AWR Repository database with an ASH report at the time this executed or other search session opportunity, (there are a number options available.)
Older Release Options
If you are on an earlier version and don’t have the Performance Page Report available to you, there are great command line tools available via the EM CLI. The following graphic takes you through the steps and the translations here for the DBA is that its similar to TKProf- you give collect the session ID, create a trace of that session, stop the trace, then create the report from the trace file.
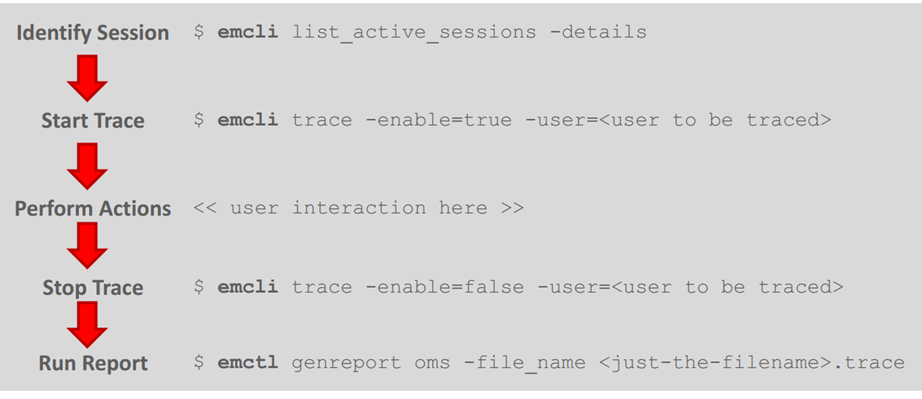
Although the report isn’t as aesthetically pleasing as what I’ve shown you from the Performance Page Report, you still are provided the data you need to answer those important performance questions about console page response and this data can be very valuable if you are looking into an issue or working with Oracle Support.