
SQL ID Specific Performance Information
When you need to have information about one SQL_ID and don’t need everything and the kitchen sink, there are a few different ways to collect this via Oracle. I’m surprised how rarely this is covered in performance tuning/optimization, (whatever the current “acceptable” term is for fixing a database when there are performance issues arise… J) classes, manuals and documentation. I’d like to cover two of my favorite here and know, there are other options that I won’t be digging into, (SQLd360, SQLTXPLAIN, tracing, etc…)
The Workload Repository SQL Report
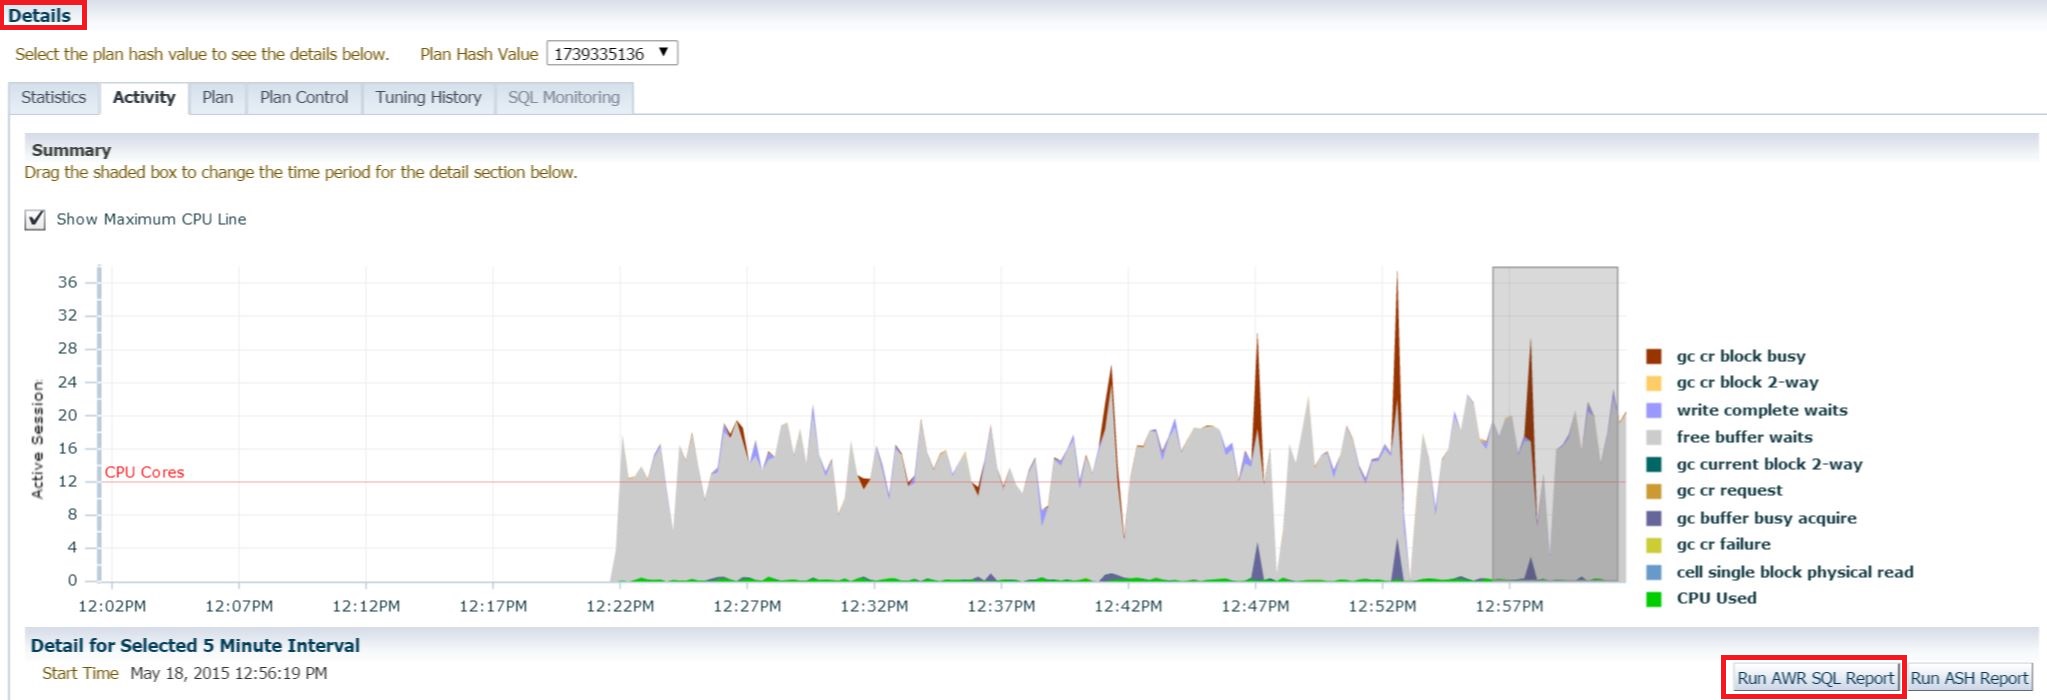
I also refer to this as the “SQL ID Specific AWR Report”. Now many of you may have come across this report via Cloud Control when you go into a unique SQL_ID in the console and upon looking at the details, you notice there are two options below the wait event actrivity, one for run an AWR SQL Report and one for an ASH report. What many don’t realize, is that this report also is available from the command line on the database host.
Report Location: $ORACLE_HOME/rdbms/admin/awrsqrpt.sql
Report Format: HTML from Cloud Control and the command line, TEXT is also an option from SQL Plus.
Requirements: Execution DBMS_Repository and privileges to run reports and store on the host or if you run via Cloud Control, then you just can save off the HTML report to your desktop.
Licensing: Yes, you do need diagnostics pack for this feature.
What’s so great about this report?
This report, like “Search SQL”, which we’ll go over soon enough, allows you to go through all of the AWR history you possess and let you know the minimum and maximum runs, execution plans for each plan hash value that exists, along with elapsed time and other pertinent statistical information about the SQL ID in question.
Notice that the version of the database, that it’s a RAC instance, along with which node in the RAC environment the statement was run in, is quickly stated, so if anyone questions this, you can quickly locate this information at the top of the report.
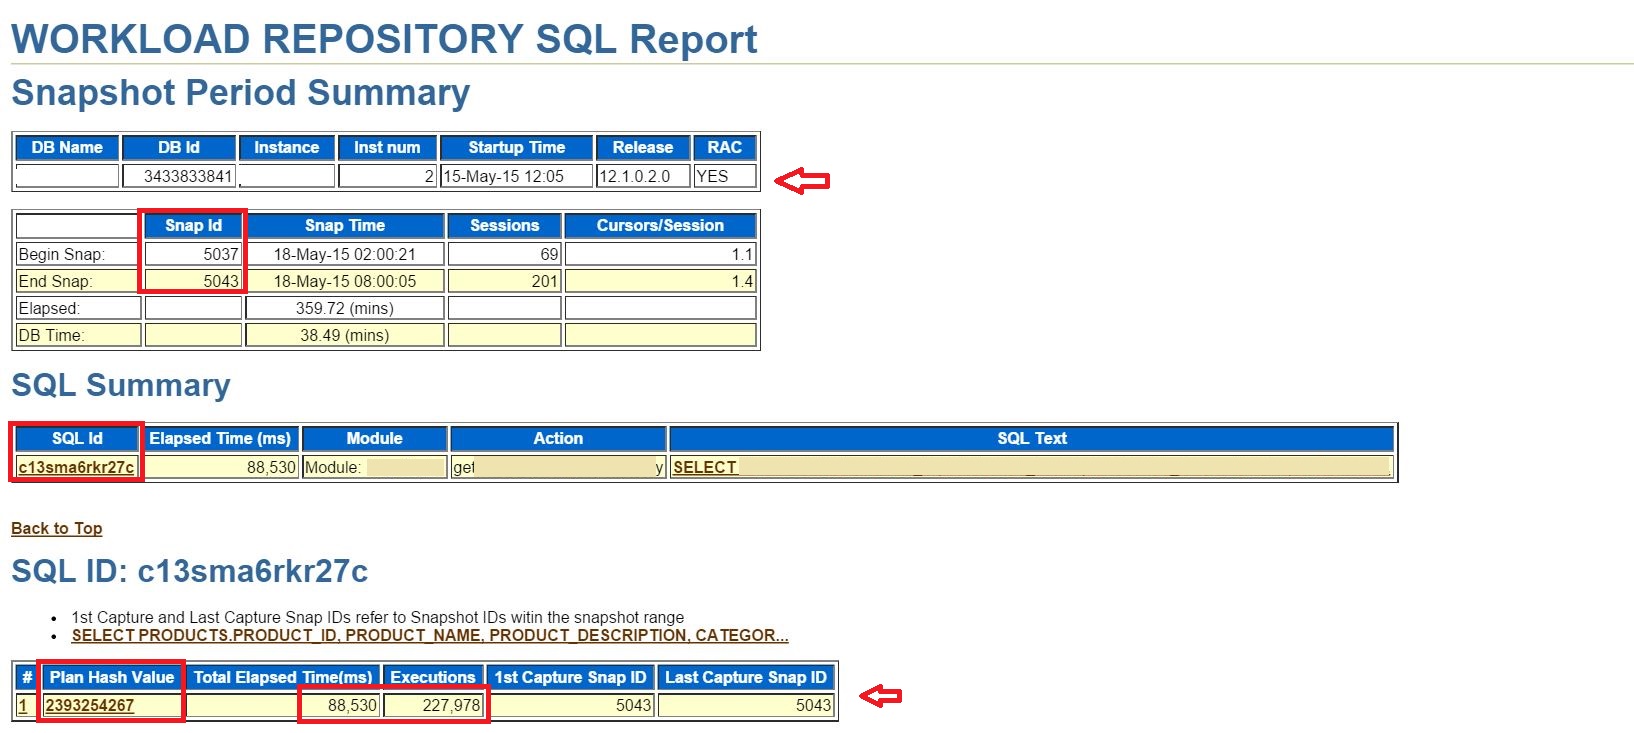
The report will display the SQL_ID in question, along with identifying if there was more than one plan hash value, (which the report will number and identify by PHV, (plan hash value) and the plan hash value ID. This will make it easy to know which execution plan and events belong to which if there is more than one. For our example, we do only have one here.
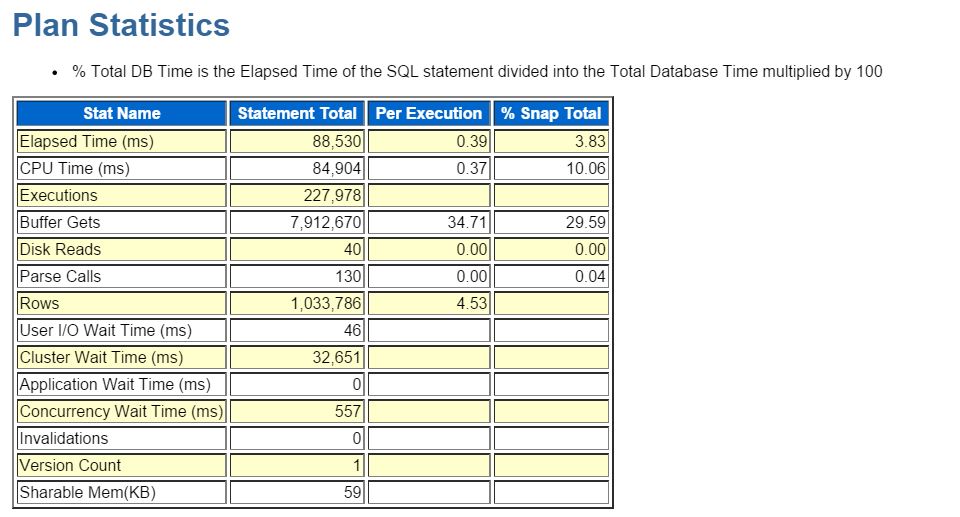
Remember for the elapsed time, this is for the total time for the snapshot timeline involved and you need to look at the per execution to see how long each one actually required to complete. These statistics are very helpful when identifying the wait event(s) that are involved in the performance challenge.
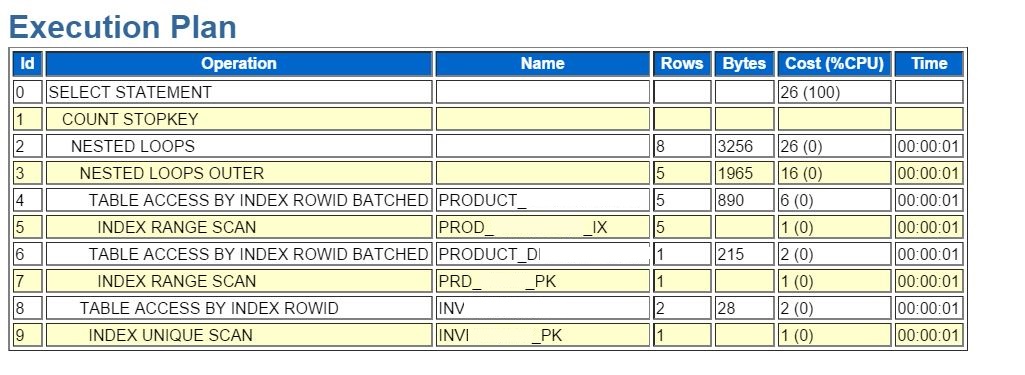
The plan is nicely formatted and you can step into the time used for each step in the process. I wish it defaulted with temp usage, but alas, that is not to be in the HTML report. This is the only area of the report where I prefer the HTML report over the text, as with this report, there is considerable size difference for storing the report and I hate giving up any data…. 🙂
If you’ve had an outage during your snapshot timeline, then this report, just like AWR, is dependent upon up time and will notify you of the issue, requiring you to pick snapshots that have no downtime involved.
Search SQL
Search SQL has been around since EM10g, but it’s one of the least known features. I like it as it gives a clean, high level view of performance over a large period of time by snapshot and then you can dig down to do research from there.
Report: None really from the command line- it’s a compilation of report features.
Report Format: None- this is via the console, but some of the reports can be saved off, (such as ADDM and other reports…) you can also copy and paste or screenshot pages.
Licensing: Due to the way we are using it here, both the diagnostics and the tuning pack will be required.
Using Search SQL
Using our same run as we used above, we can identify a SQL_ID that is causing us concern and we want to investigate further-
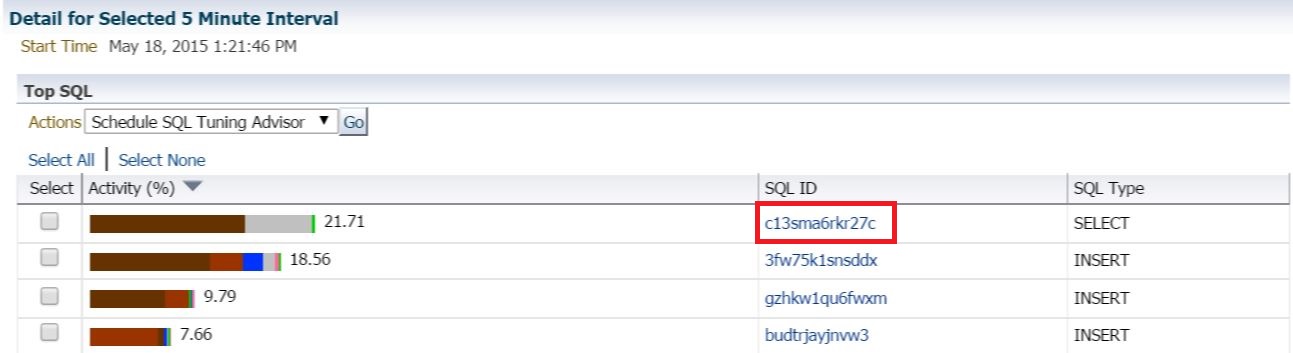
Copy the SQL_ID so you can paste it in the proper field in the Search SQL console. You’re now going to leave the Top Activity, (or ASH Analytics, whichever you are using, both work great for this type of initial identification…)
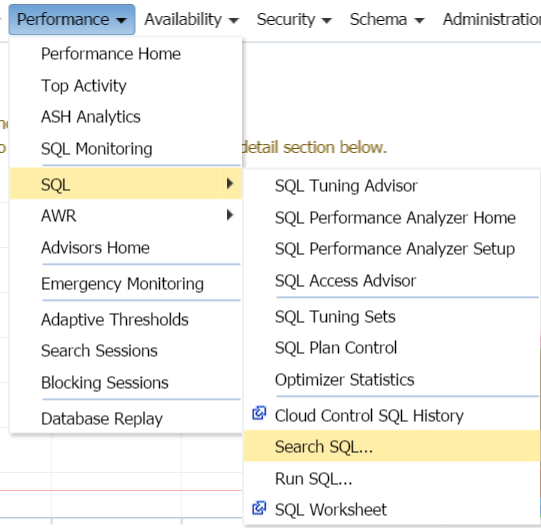
Each Search SQL console is database specific, so click on the Performance drop down, SQL and then Search SQL for EM12c, (EM10g and EM11g, this is directly under the Performance menu….)
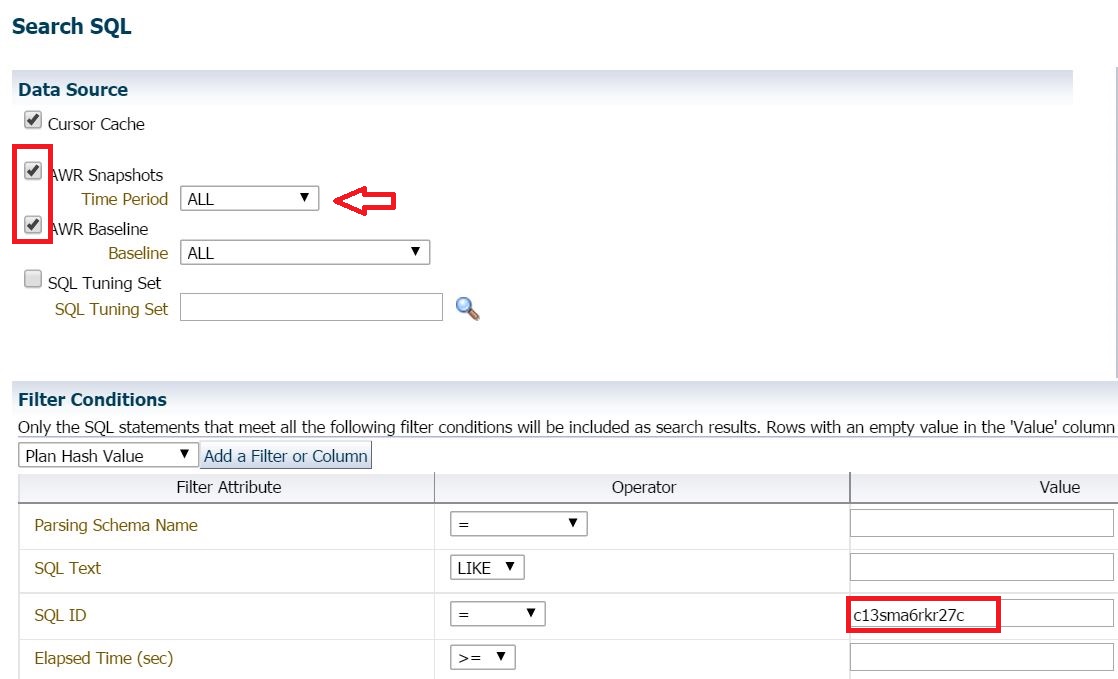
Update the following sections:
- Add AWR Snapshots and Baselines.
- Choose All snapshots to verify that you are seeing the entire performance data contained in your AWR. If your database is set with the default time for retaining AWR, this is 8 days for 11.2 and above.
- Enter in or paste the SQL ID into the SQL ID value section.
- Click on Search, (don’t click on Show SQL, as I know this is a bit misleading, but it will just show you the SQL statement to be run by Cloud Control…)
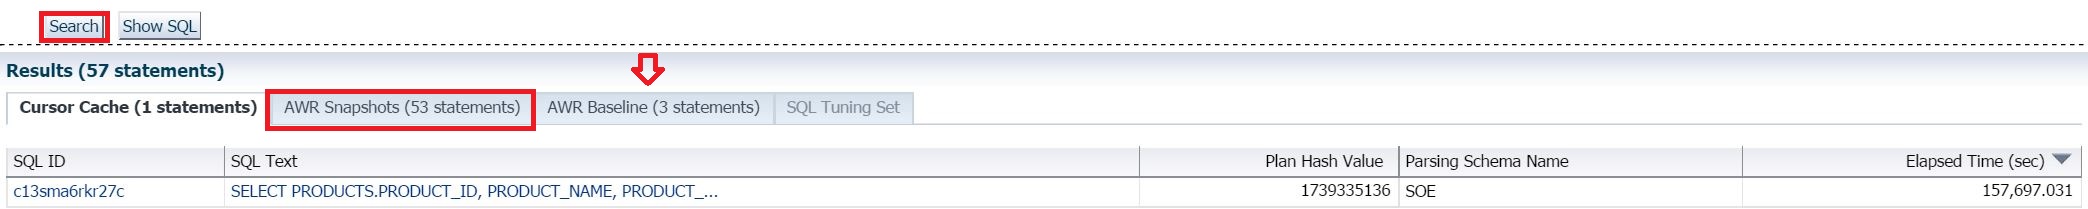
Four tabs will be shown, don’t be surprised if you don’t notice the completion as the cache often only returns one row:
- Cursor Cache, (in the cache currently)
- AWR Snapshot data, (where we’ll spend most of our time…)
- AWR Baselines, (good data to have to back up changes in plan hash values if you have your database set to update automatically or if someone’s put in a plan from a baseline run.)
- SQL Tuning Set if you’ve chosen to examine those, too.
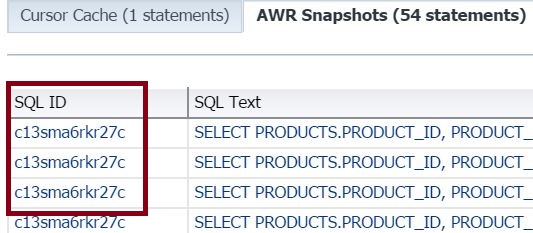
You CAN examine the existing run and looking at it this way really shows you how it’s currently running vs. how it has run, but if you’re just looking for when it really ran well, then skip the curor section and jump to the AWR snapshots to see this SQL ID for ALL snapshots in the AWR-
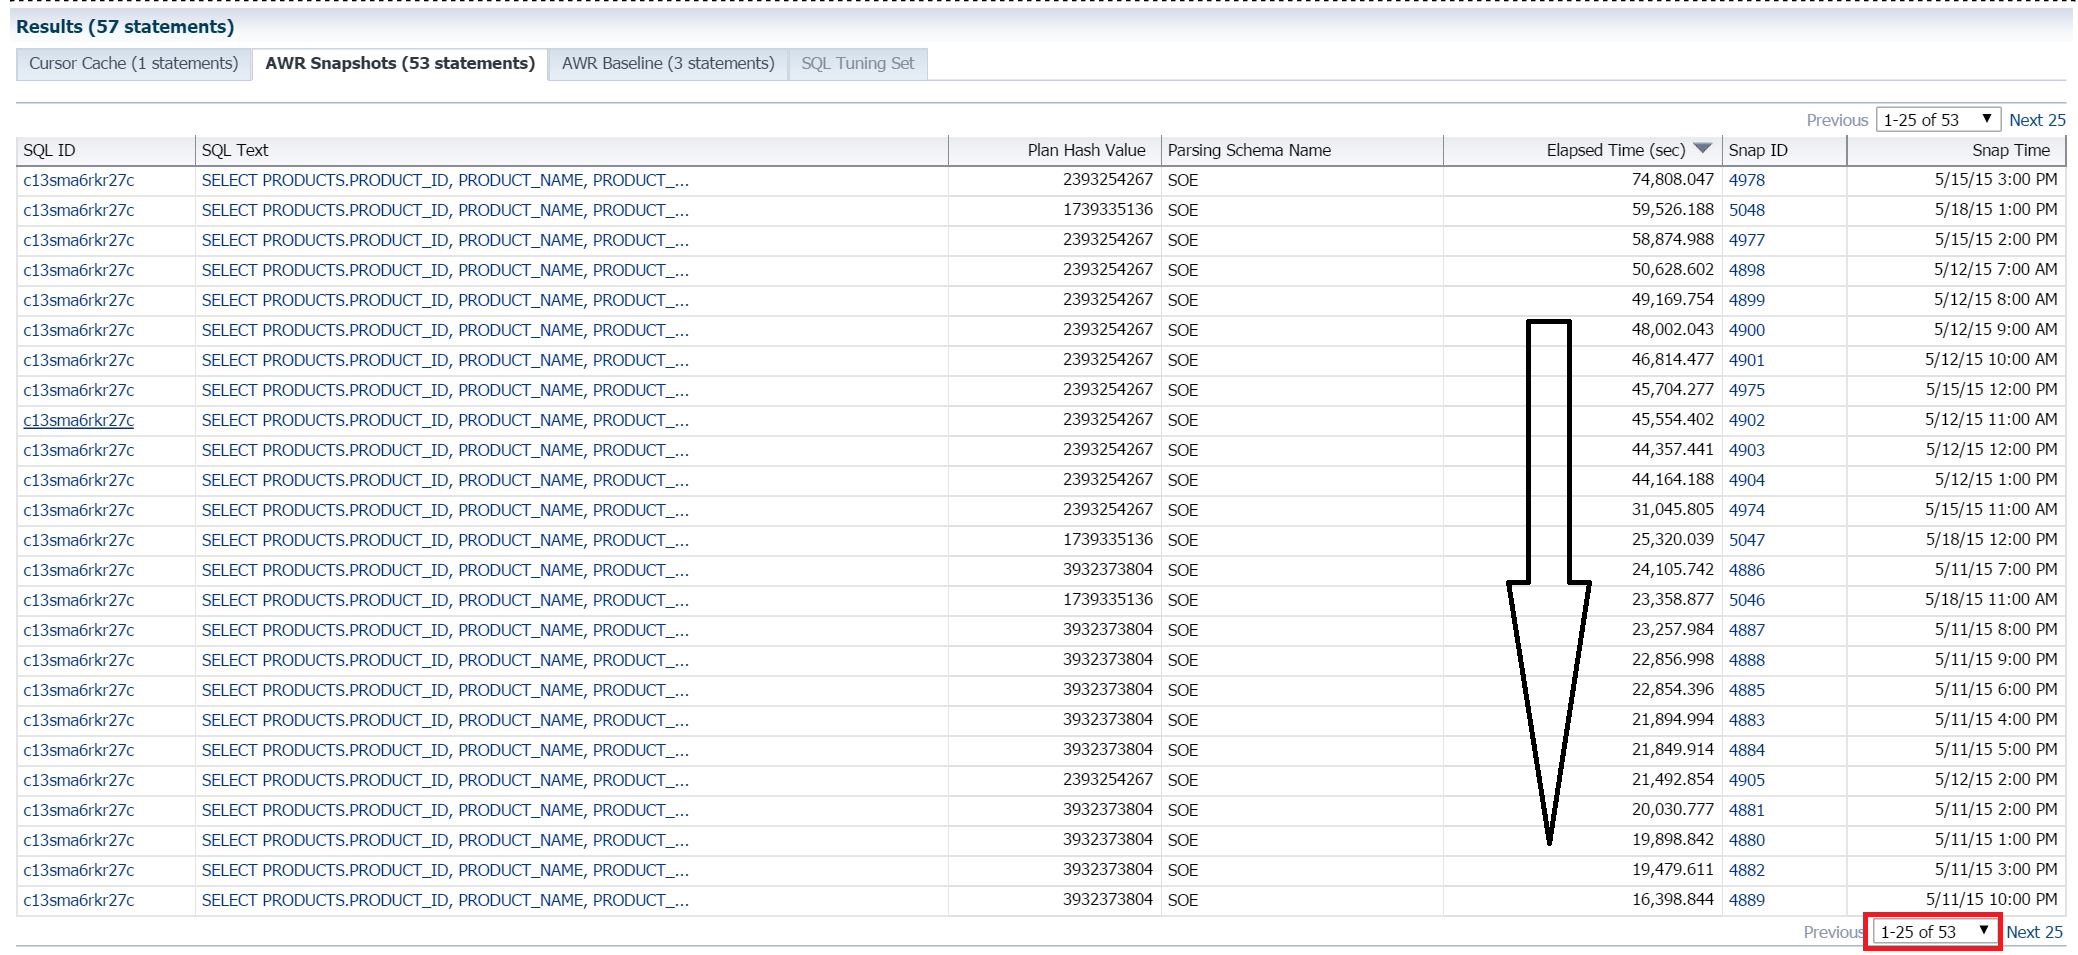
You’re seeing all of this from the largest elapsed time to the least descending, so although we’re able to view any patterns on how the SQL may be degrading over time, note if there are plan has value changes, (which in our example, there are and we didn’t see that for this statement in our AWR SQL Report) and click on the “Next 25” link at the bottom to get to the lesser elapsed run times.
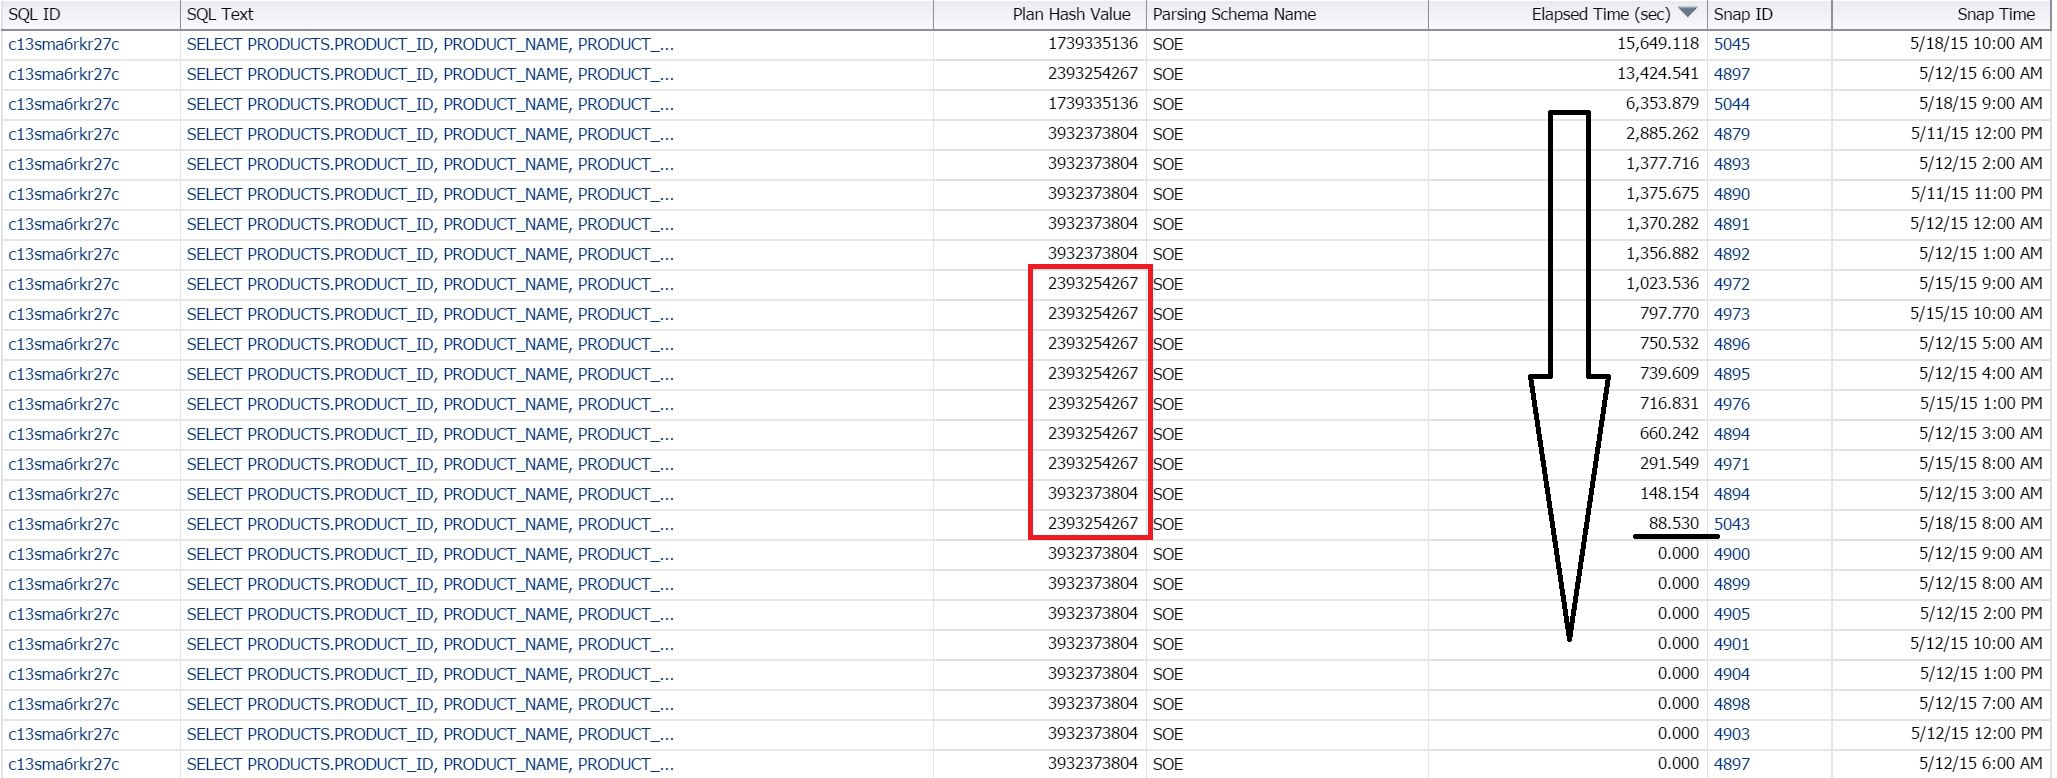
There are some runs with 0.00 on the run times. You can investigate these, but we’d find that they hadn’t completed or no rows were returned. What is more important are the runs where we see overall run times that are efficient in the elapsed time and that rows were returned. I’ve marked them in our report.

Upon closer inspection, you’ll also notice that they all belong to the same plan hash value except for one run. This is a good indicator that this plan has value should be identified as the best over all for this query.
Now as we all know, it’s not just about the one query. The database could impact the run as well.
- What resource limitations were in play?
- Where there any concurrency issues?
- Where there any other factors that overall effect performance?
On the right, you’ll notice that the snapshots are links. You can use these to inspect the over all performance of the database during the snapshot interval the execution occurred.
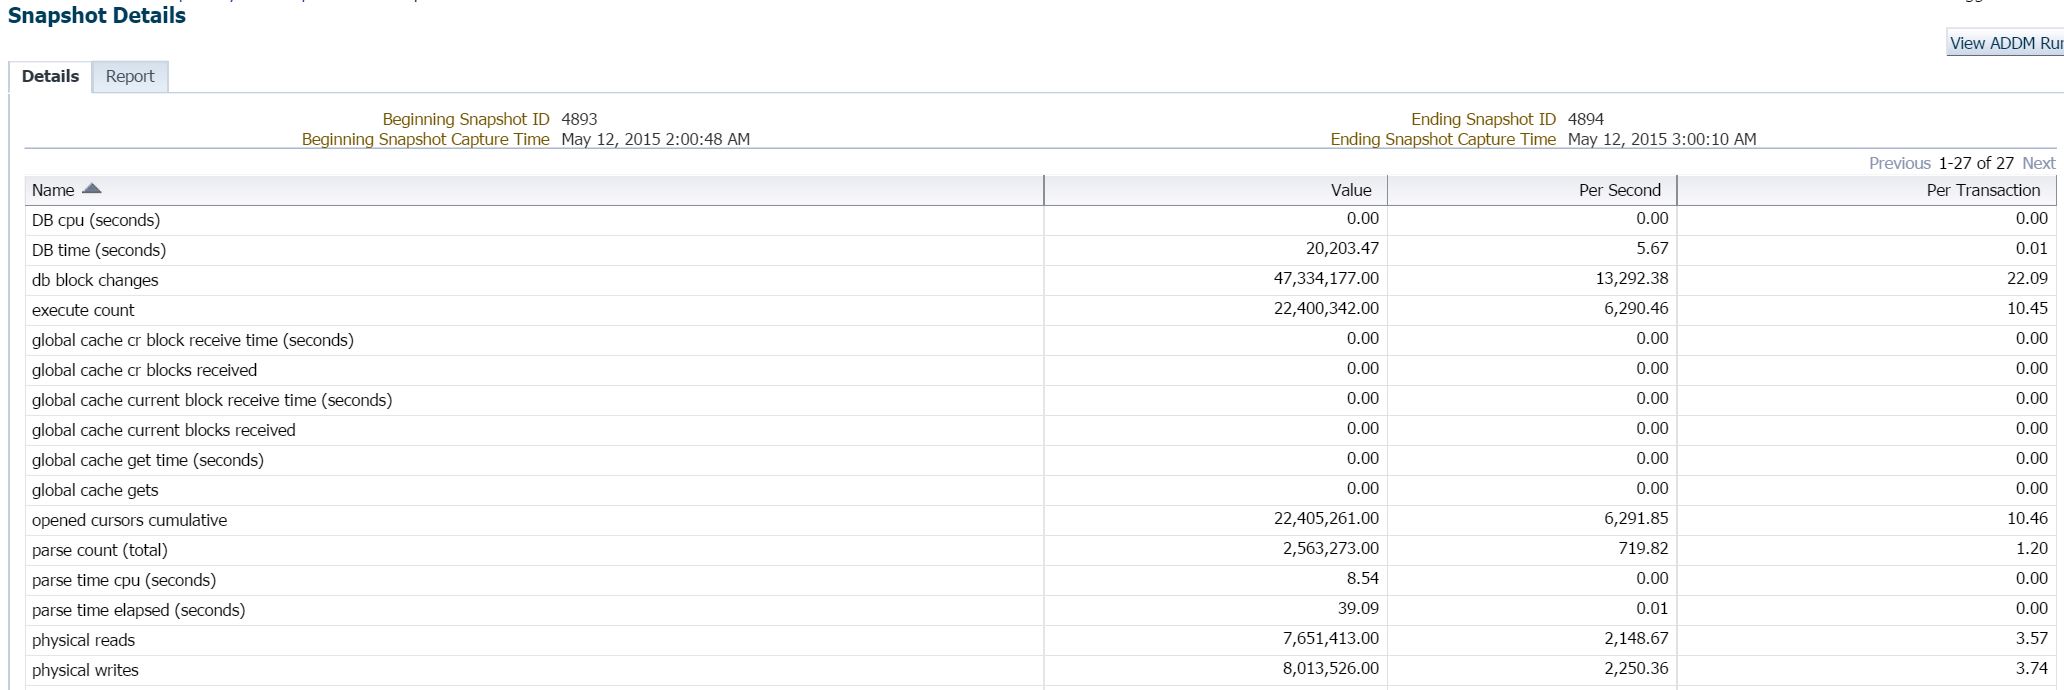
Here’s all that high level statistics info at the database level. You also have the opportunity to run an ADDM report from here and see that “all that’s important” view of your database.
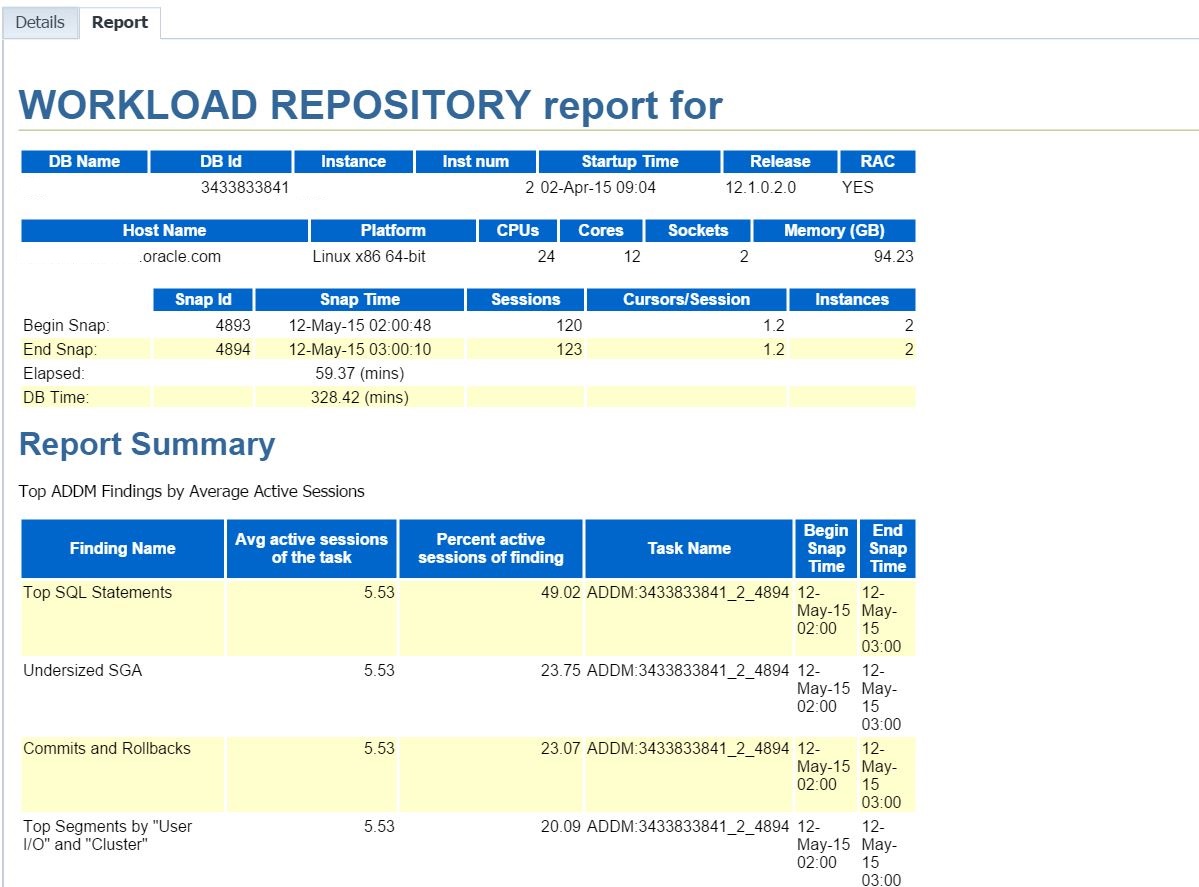
Now the second tab is going to offer you the workload repository report for this database, including the summary to tell you, is there anything up in this database at that time that you should be aware of.
You can go back to the Search SQL report and then look at the individual executions listed, too.
This will take you to the SQL Details page for whichever one you click on-
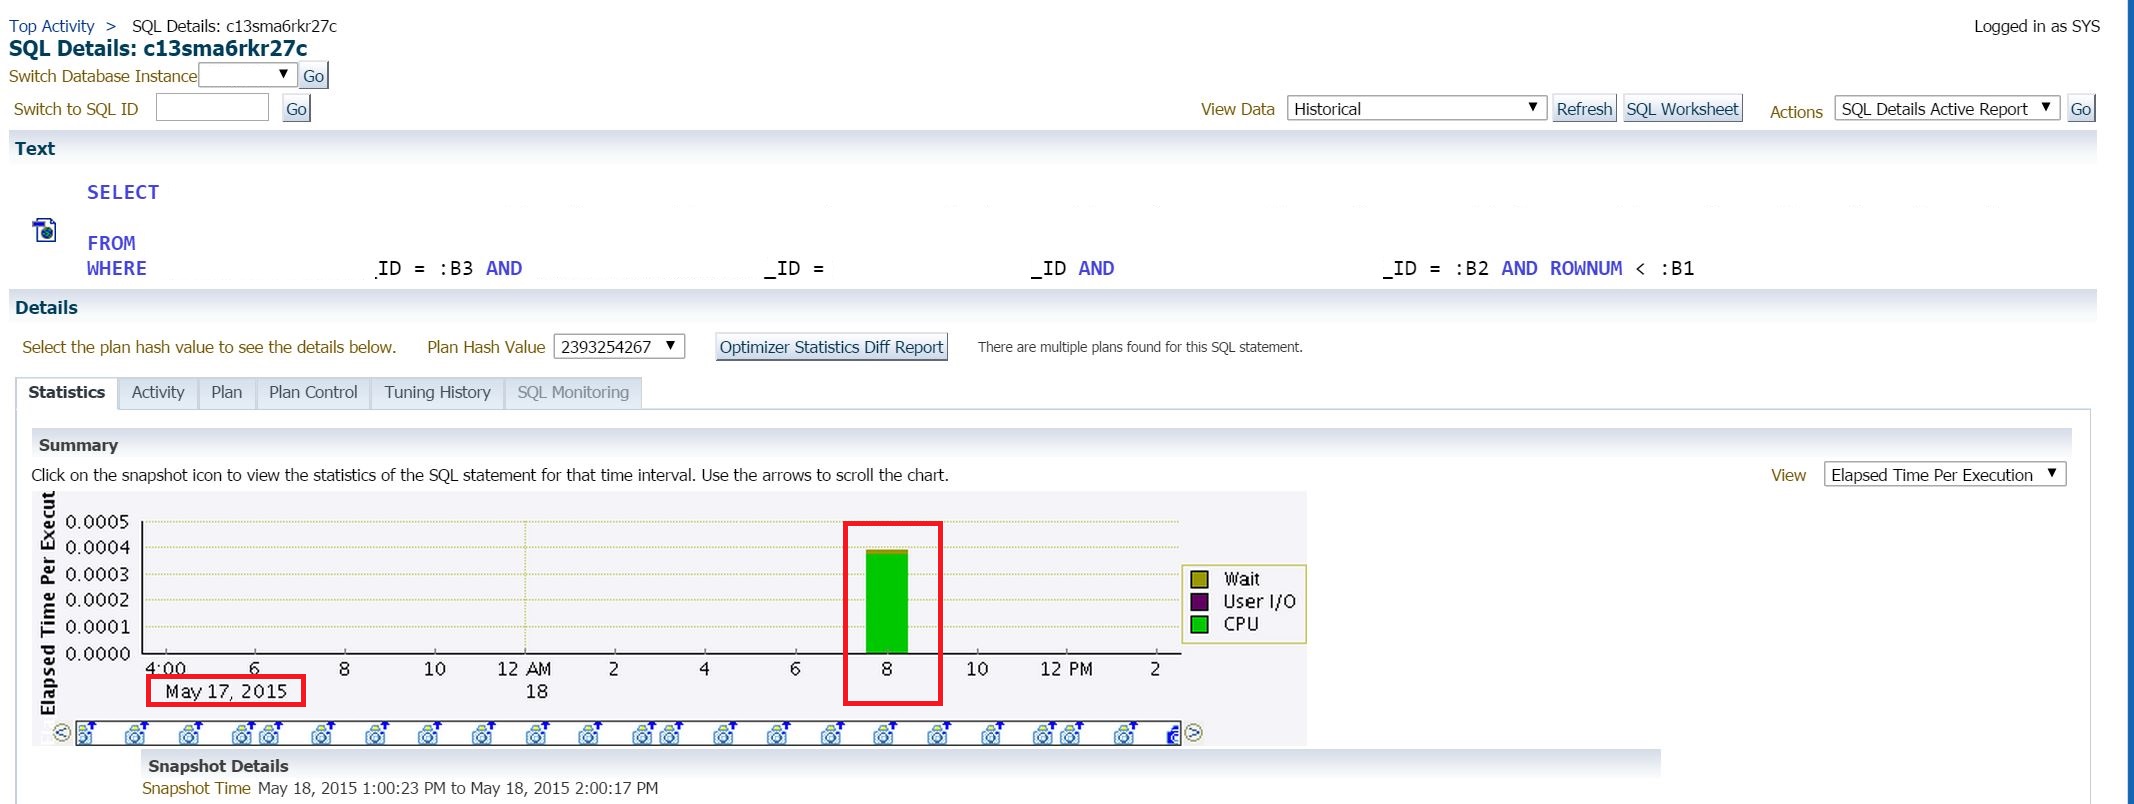
Just as with any SQL Details, you can see the activity, the plan, plan control, etc. The example above is for an execution from the day before, so it’s kind of an easy way to get to it vs. going and searching historically through Top Activity.
Baselines
Now why did we choose the Baselines as part of our search? Baselines, especially when they are automatically implemented, can impact performance at times and knowing this information can quickly let you know it wasn’t another culprit involved.
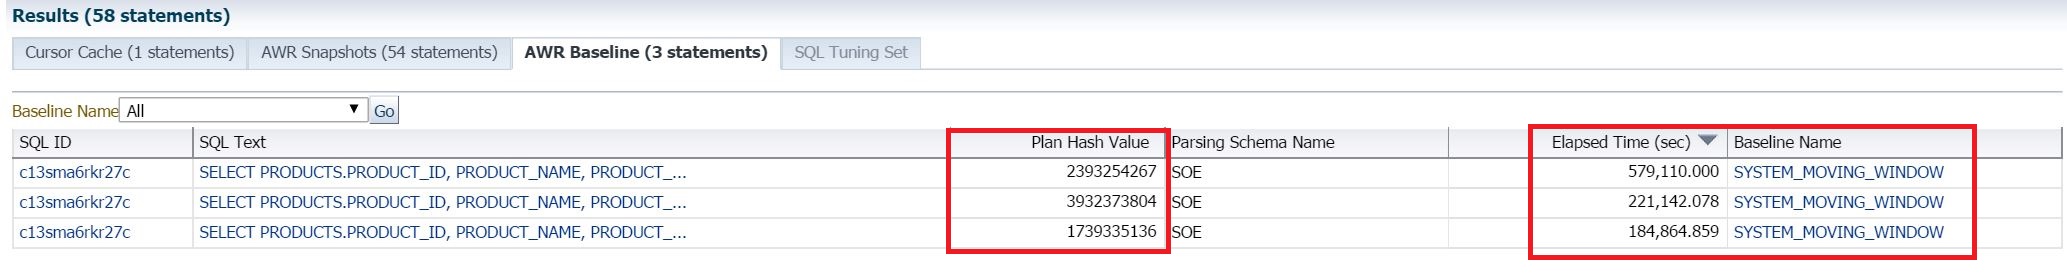
We can see what plan hash value is attributed to what baseline, the overall elapsed time and you can click on the Baseline Name link to see when and if it was implemented to diagnose if its part of your problem.
Hopefully this gives you some more tools for your arsenal when that boss or peer is standing at your desk and demanding an answer to a challenge- what more can we ask for but answers! 🙂