
There are a large number of “moving parts” when performance tuning or trouble shooting an Enterprise Manager environment. The new EM performance features, (available in release 12.1.0.4) are there to assist you in understanding the source of the issue and can really make the difference for those that are unfamiliar with the challenges of Weblogic, java, network or other complexities that make up EM12c and aren’t commonly thought of as part of the DBA’s job role.
Now that we’ve finished with the Health Overview, we can look deeper into the health and performance of the two most well known components of the EM12c architecture, the Oracle Management Repository, (OMR) and the Oracle Management Services, (OMS).
Due to the impressive features offered in the new EM performance consoles, I’m going to break these up into multiple posts and start with OMR and focus on the Repository Tab.
The Repository
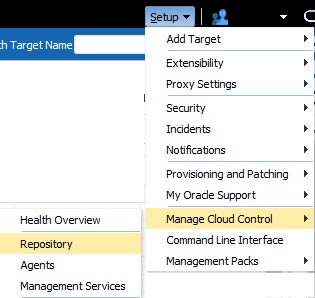
The Repository Tab is accessed via the same Setup menu in EM12c console:
Once accessed, there are a number of tabs at the top of the page, Repository, Metrics and Schema. Starting with the Repository tab, (Left to Right) we’ll inspect what specific performance data is important when reviewing an OMR.
Repository Tab
The Repository page is going to display a number of graphs that tells you everything from specific information about the OMR database, incidents involving the OMR database and even how collections performance at the database repository level. It is important to remember that this tab is all about the Repository, (OMR) and should not be confused with the Service, (OMS).
Basic Information
We begin by viewing information about database name, space allocated, space used number of current sessions actively connected to the OMR.
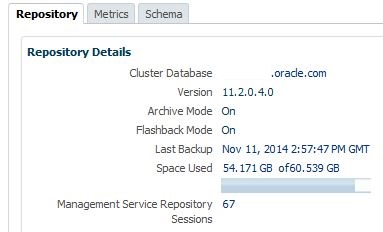
All of these are links, so you can click on the link and a you’ll be taken to a detailed view of the data and more information to investigate if you have questions.
For the Target type for the OMR, you can click on the target name, (db name) and the console will take you to the home page for the OMR database.
Click on Last Backup date and the console will take you to the backup activity report for the OMR database.
Click on Space Used and the console will then bring you to the Management Services and Repository page drill down for Repository Tablespace Used.
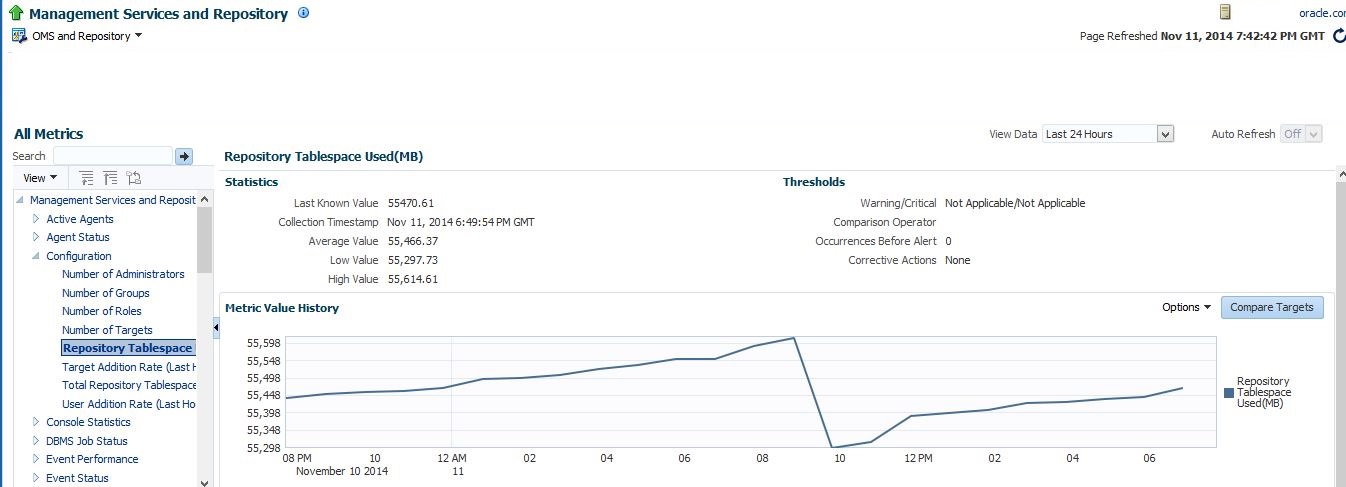
There is a ton of information in this location and we’ll dig deeper into it as a separate post, but just to understand how user friendly the interface is, note the links you have at your fingertips right here.
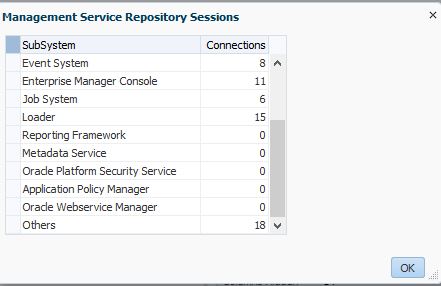
If you click on Management Service Repository Sessions, the following table with session type and counts will display:
Incidents
On the right hand side of the top of the page, we access to the incidents linked to the OMR. No other incidents will be listed except the ones connected to the OMR, so this is a great place to check first when you are experiencing issues.
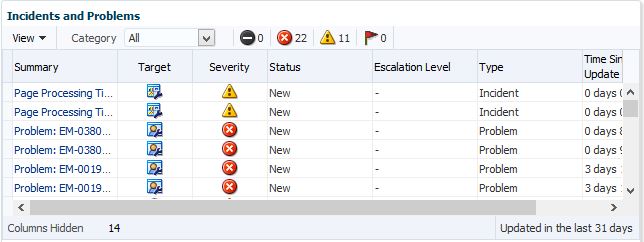
Notice that it includes incidents for page processing time outs to the OMS and collection timeouts. This can be very helpful when you are experiencing slow response and need to know where the issue is sourced from.
Initialization Parameters for the OMR
Not only does the next graph identify what size category you fall into for your Enterprise Manager environment, (small, medium or large) but it also lets you know if any of your parameters are outside of the recommended sizing for that category.
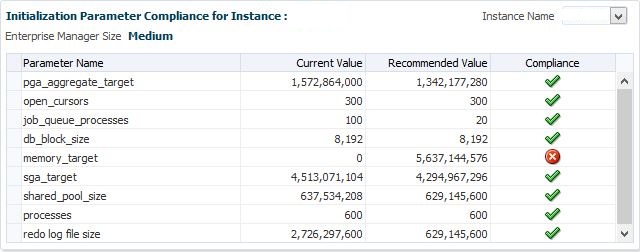
In our example, you can see that we don’t have a set MEMORY_TARGET value and that is outside of our compliance as we recommend to have this set to one. We can also view each of the values we do have set and how they compare to what Oracle thinks the minimum value for that category of OMR size should be.
Job Scheduler Status
To the right of the Init parameters is all the graph with information pertaining to all the jobs running in the OMR to support the Enterprise Manager environment. Unlike Job Activity in the console, this is reporting all those jobs that are taking care of the Enterprise Manager.
If a job fails and you have the option to edit the schedule to run again, (the glasses icon) then you can click on the glasses and the following popup will show and you can then enter a new time for the job to retry:
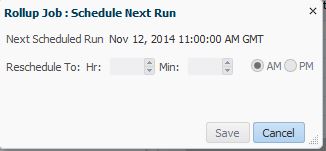
Once you enter in the new time to run the job, click on Save and verify that the job has been successful in the console view, (green check mark vs. a red X.)
Collections Performance
At the bottom left, Collections is the next category that’s covered. If collections aren’t uploading to the OMR, then the console isn’t able to provide the most up to date data and notifications of incidents and alerts aren’t sent out to notify administrators of issues. Timely collections and the performance of collections is of a great concern to an EM Cloud Control administrator.
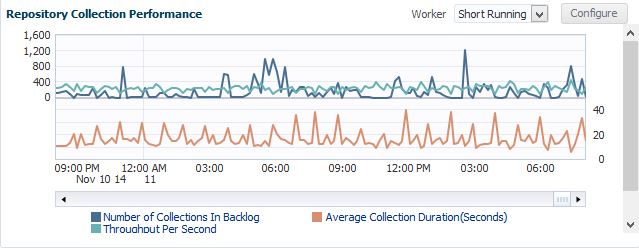
The graph is well laid out and shows clearly the number of collections in backlog and throughput performance. The top of the graph, when hovered over, will show you the warning and critical threshold line for number of backlogs allowed.
Backlog is an issue, as if it gets too high and hits the threshold, your agent can stop uploading. You can also see the duration, on average of the collections and view over time if the duration is increasing. If you use a lot of metric extensions or plug-ins, this is something you’ll want to monitor, so this graph is extremely helpful when inspecting collection performance.
By hovering your cursor over the Collections Backlog line in the graph, I then am offered a number of options to look into the performance:
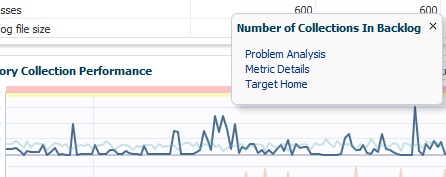
You have the option to click on Problem Analysis to look into the backlog, Metrics Detail or go to the Target Home.
Problem Analysis
As my EM environment is running quite smoothing at the OMR level, there isn’t a lot to show you in the Problem Analysis, but I wanted to at least give everyone a peak into this cool, new tool.
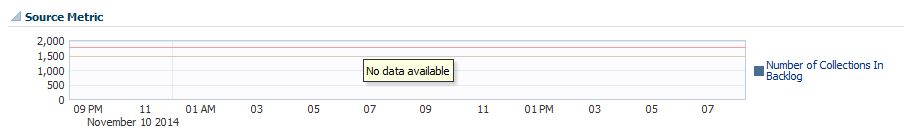
First of all, if I did have an issue, there would be collections showing in backlog. This is very important for an administrator to check and ensure that backlog is not occurring.
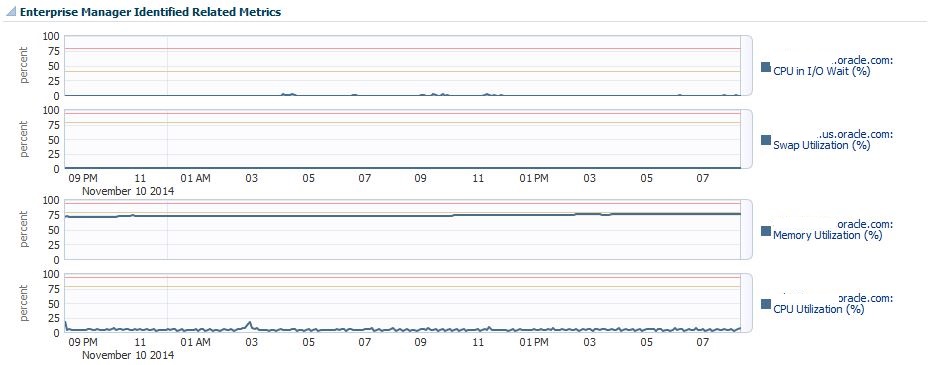
As there is no backlog, you can see, my resource usage by my collections is pretty consistent and quite below the thresholds expected for most of the resource types shown:
You can also export the data from the table view, (small link at the bottom right of the screen, not shown) if you need the raw data.
You will note that my memory utilization is creeping, little by little to the critical threshold. This is commonly due to java garbage collection causing a small memory leak and should be reviewed from time to time. If it is considerable, the java heap should be examined and a more efficient value set.
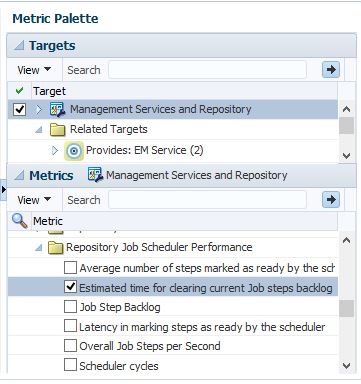
Adding Metrics to the Performance Analysis
On the right hand side of the Performance Analysis, you will notice the Metric Palette. This offers you the opportunity to go from the standard configuration to display more data on the existing metrics or add analysis on other metrics, such as Agents and Page Performance.
It’s important to know, even though you can be brought to this page from many different links within the OMR/OMS Performance pages, while you are in the Performance Analysis, you can inspect other performance metric factors than just the original ones you are reviewing.
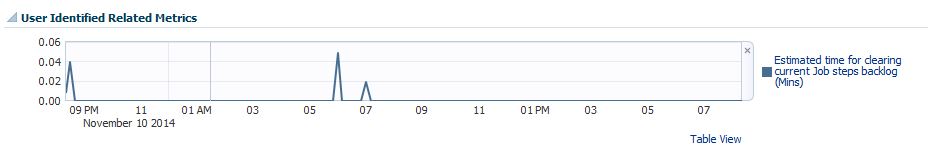
For our example, we’ll add an additional metric graph,(Time estimates for clearing backlog) for review to the left hand analysis page-
We now have an additional graph on the left hand side analysis to compare to our existing data to see if the load times correlate to resource usage:
This can be done for dozens of metrics and offers some incredible analysis power when researching performance issues with EM12c. The Performance Analysis link is one of the most powerful tools for locating where a bottleneck in performance is coming from and very quickly. The fluid ability to add metrics to the graphs section and see how they correspond to the other resource usage is incredibly beneficial as well.
Metric Details
Now back to our Collections graph, if you remember we had three options when we click on the blue line:
By clicking on the Metrics Details link, we’ll then go to performance page for All Metrics.
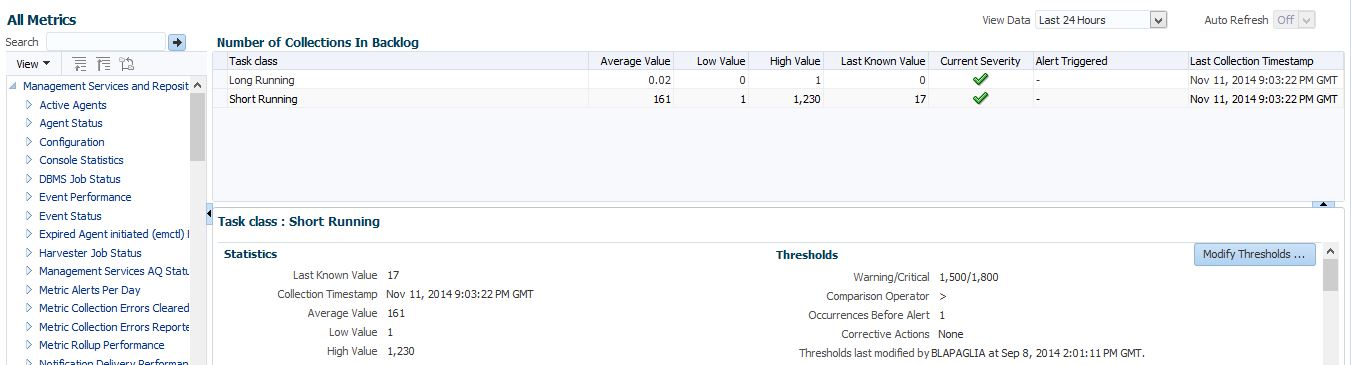
This page displays information about the number of short and long running collections in backlog and will display the status if the threshold value has been hit for backlog quantity. The page functions similar to Incidents, in that you can click on the right middle button to display the Task Class information highlighted to full page.
You are also offered the option to modify thresholds if the current values don’t meet the demands of the system is under currently, but know that the recommended values are their for a reason and the option to change them should be seriously researched beforehand.
Target Home
This link takes you to the Overview and Health page for the OMR. I get to save a lot of typing by just sending you to my blog post on this great feature! 🙂
A final clarification, too- the three options available, Performance Analysis, Metric Details and Target Home are options available for each metric by double-clicking in the Repository Collections Performance or the Metric Data Rollup graph, which we’ll discuss next.
Metric Data Rollup Performance
The last graph, in the right hand bottom corner, is the for metric data. This graph displays the number of metric records rolled up and the throughput per minute for this data to be uploaded into the OMR.
We again have the ability to inspect performance analysis by double-clicking on the metric in the graph.
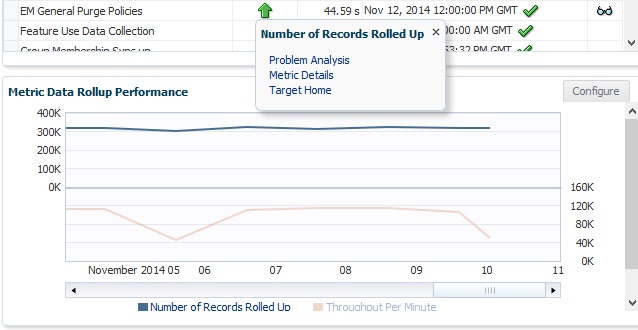
Each of the three options work almost exactly the same way as I demonstrated for the Collections Performance, but the data is based on the metrics rollup.
The main functionality of each of these sections is to realize how many different ways you can do performance analysis on different performance data:
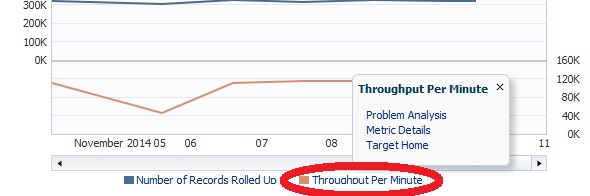
Yes, even the legend can be clicked on and a detail option chosen.
That completes the review of the Repository Tab, remember, I have two more tabs to cover in posts before we dig into the Management Services and Agents performance consoles.
![]()