
I had a chance to take a closer look at the Zero Data Loss Recovery Appliance, (ZDLRA) via Cloud Control today and really liked the dashboard that’s included in the plugin for the product. This post isn’t going to cover the installation of the plugin or configuration- I was just intrigued by the dashboard and wanted to go over the great features that are part of it.
Accessing the ZDLRA
As with any Targets, the ZDLRA is going to show up in the All Targets menu and also has a target type filtered drop down in the Targets menu.
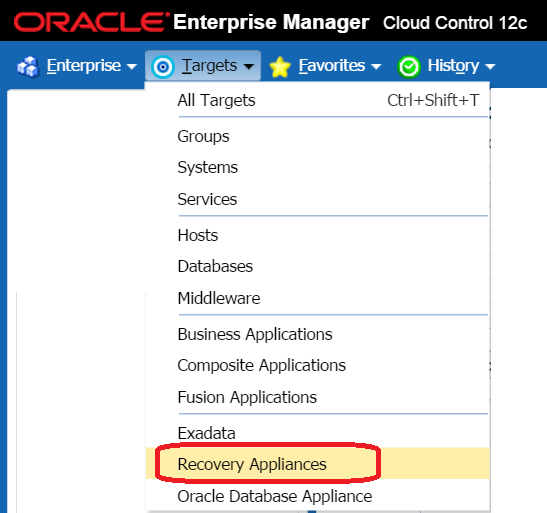
All ZDLRA targets discovered and configured will be listed under this view, (I’ve renamed mine to protect the innocent.
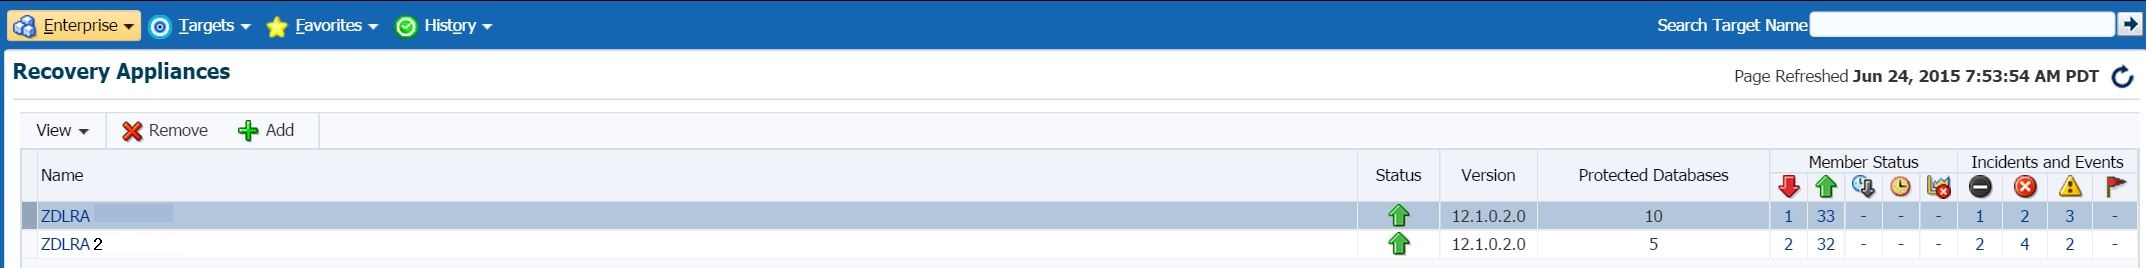
The reason for more than one ZDLRA is to ensure their is redundancy for disaster recovery, which you’ll see in the upcoming overview of the current environment we have set up for our High Availability Enterprise Manager environment. If we double click on the first ZDLRA listed, we’ll come to the main dashboard, which we’ll dig into section by section, left to right.
ZDLRA Targets
As with all targets, there is the system target which can be expanded to show all the associated database type targets that make up the ZDLRA.
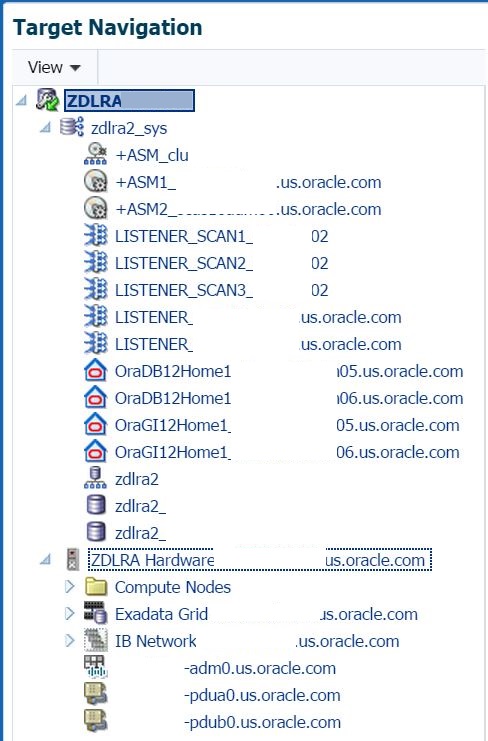
Below the database targets associations are the associated hardware targets, which also can be expanded to show that the ZDLRA is based off engineered system architecture.
Each of the associated targets are links that can take you to the home pages for each target shown in the list.
Backup Information
To the right of the target and associated target information, we start to view the high level information about what the ZDLRA handles- backups.
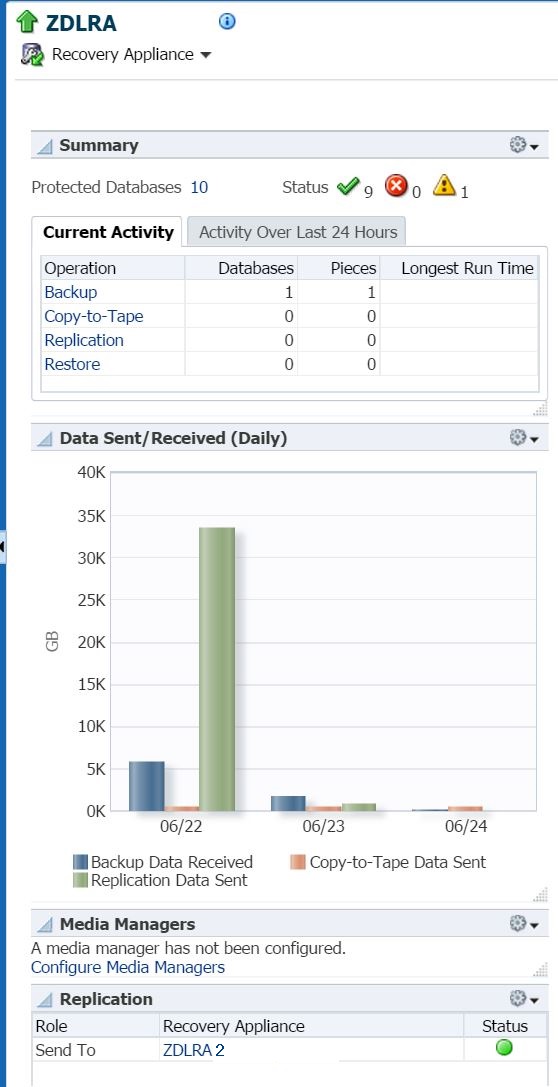
At the bottom of the above graphic, notice that the ZDLRA is replicating copies of all backups to the ZDLRA2 to ensure that more than one copy of backups exist for DR purposes.
Summary
If you switch from the Current Activity to the 24hr historical view, then you can see a lot more information about the backups the ZDLRA is responsible for:
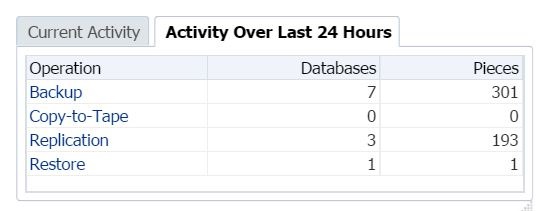
As you’ll see above, there are 7 databases that are currently being backed up to the ZDLRA. You can click on “Backup”, which will then display more details about the backups:
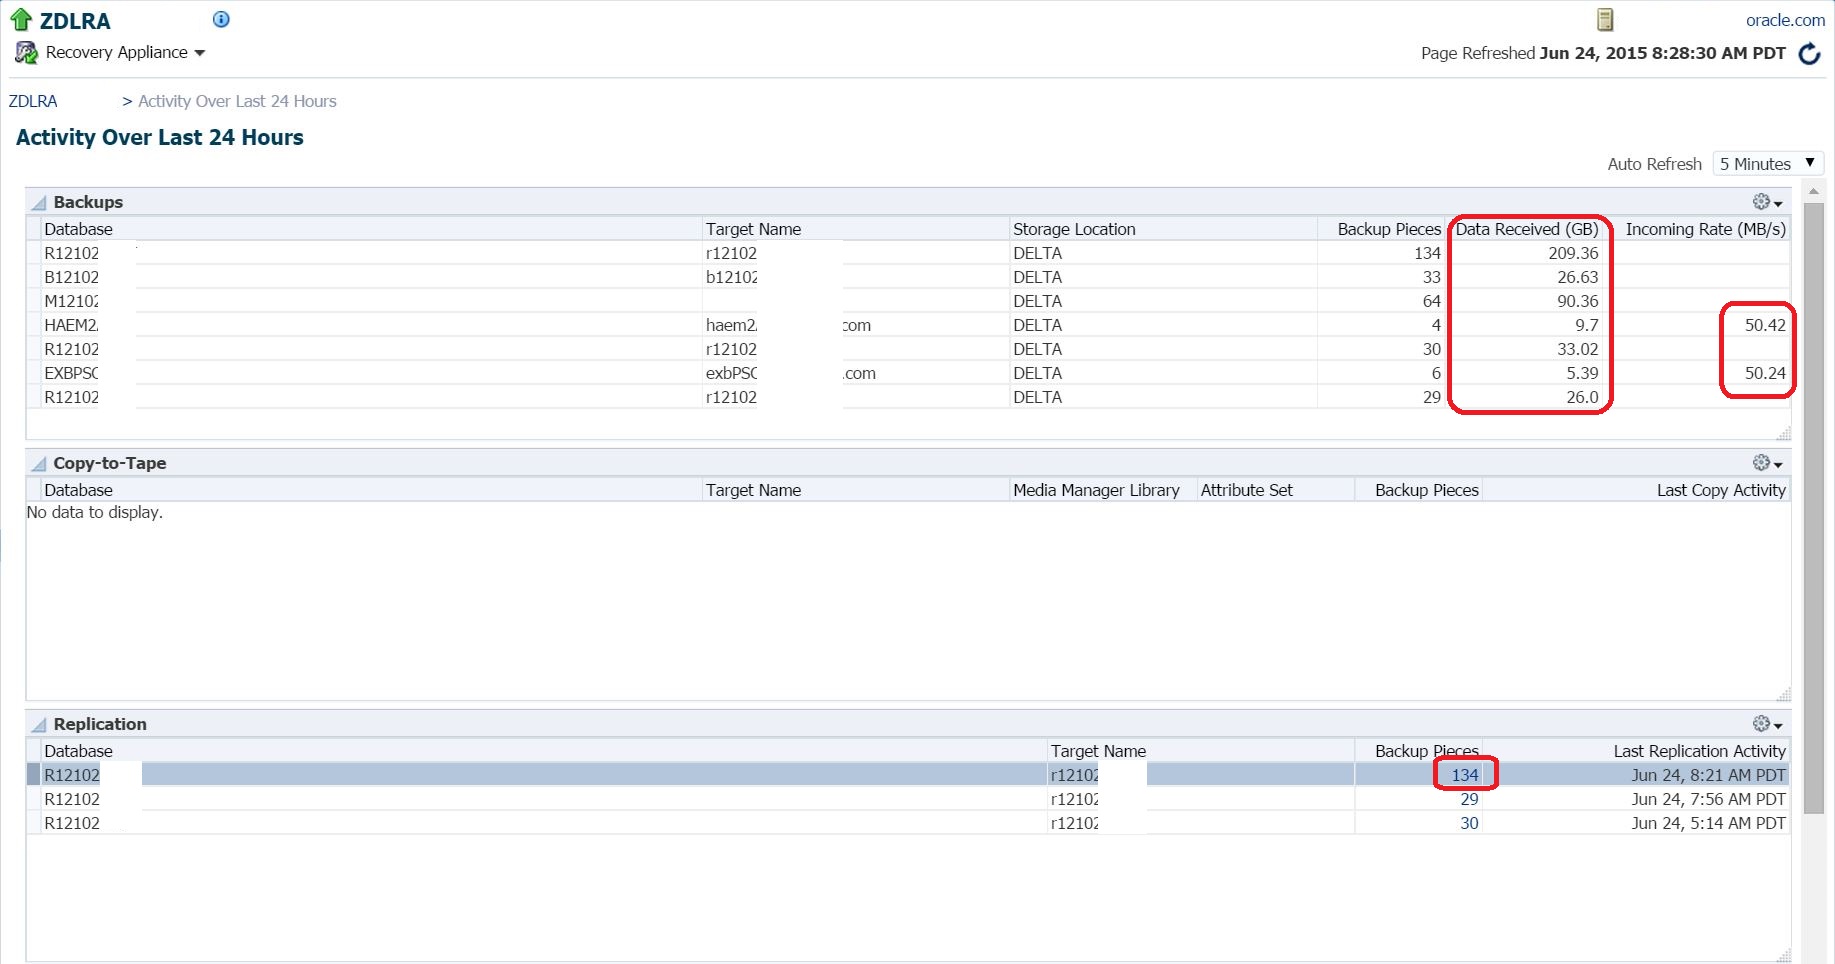
You’ll now see the database targets that are backed up, the backup pieces, the amount of data received in GB’s and if available, the transfer rate for the backup. As the backups are being replicated to the ZDLRA2, there aren’t any copies being pushed to tape, which we can also verify in the Replication section at the bottom.
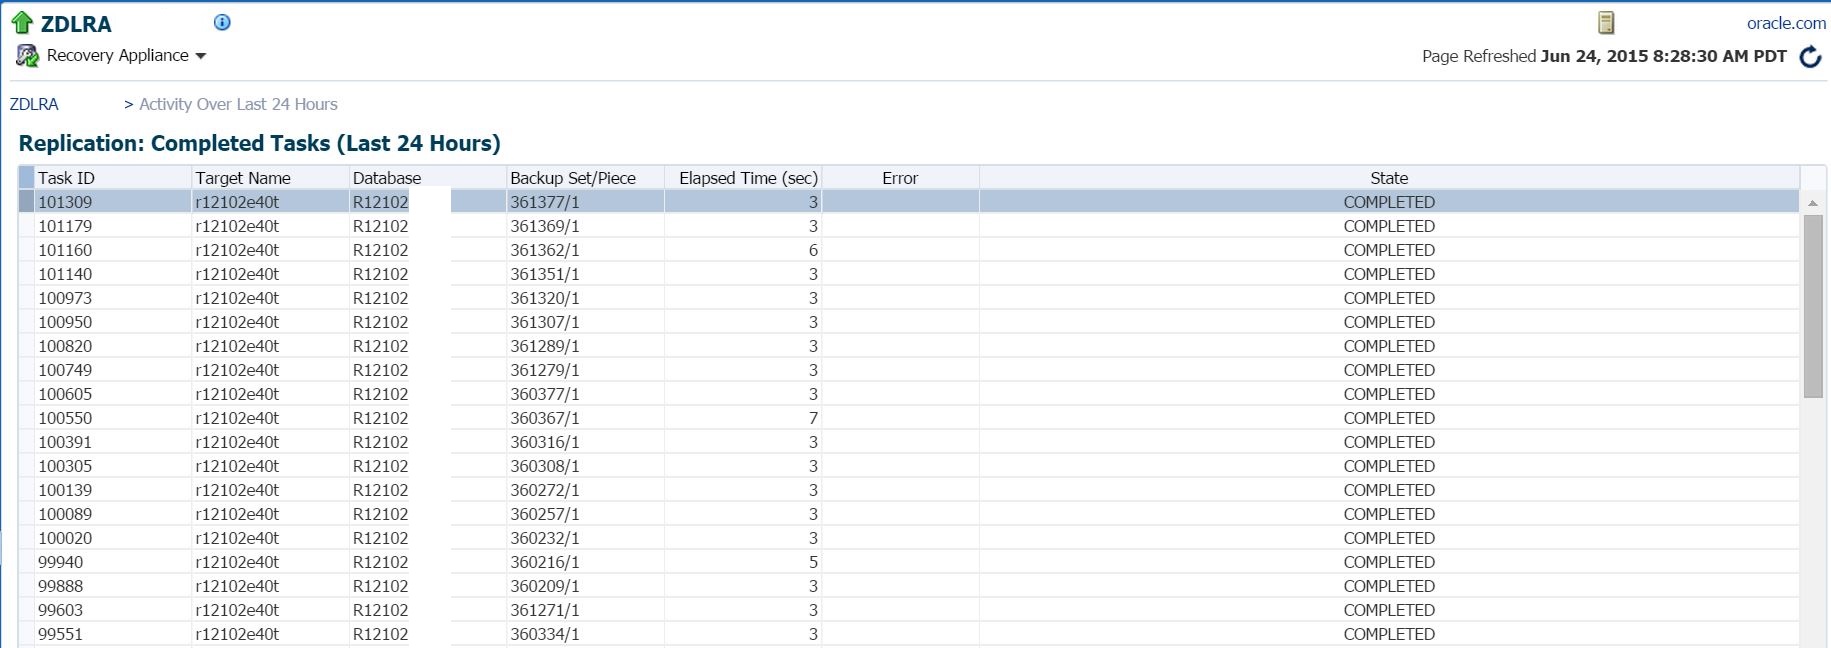
We can click on the link for any of the Backup Pieces and it will then display the job task ID, the target, the database, backup information, elapsed time and if there are any errors, along with completion state.
Back on the main dashboard page, we can then inspect some of the backup load to the ZDLRA. As you move your cursor across the graph, more information will be shown:
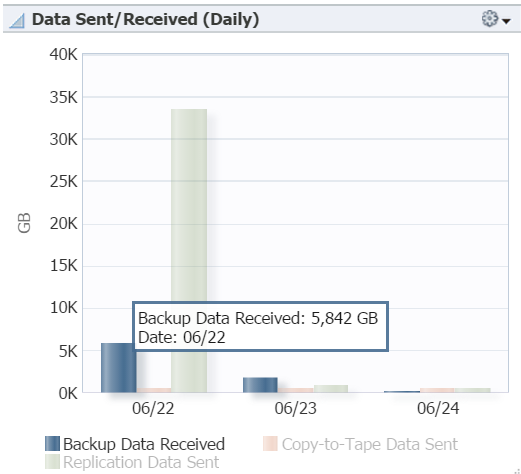
The blue displayed in the graph is the Backup Data Received on the first ZDLRA. Highlighting a section on the graph will show the amount of data and date received.
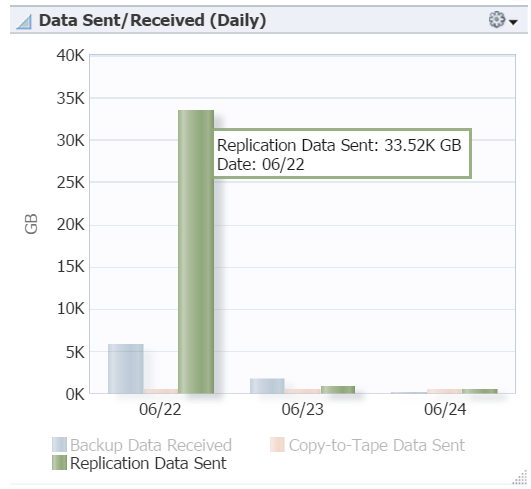
Highlighting the green section in the graph will bring up a quick highlight of the amount of data replicated from the ZDLRA to the ZDLRA2, including date. Orange is also shown for backups copied to tape, (if any are performed.)
Performance and Space Information
On the right side of the pane, we start with compliance information, can view the rate at which data is received to the ZDLRA and the send rate for replication to the ZDLRA2.
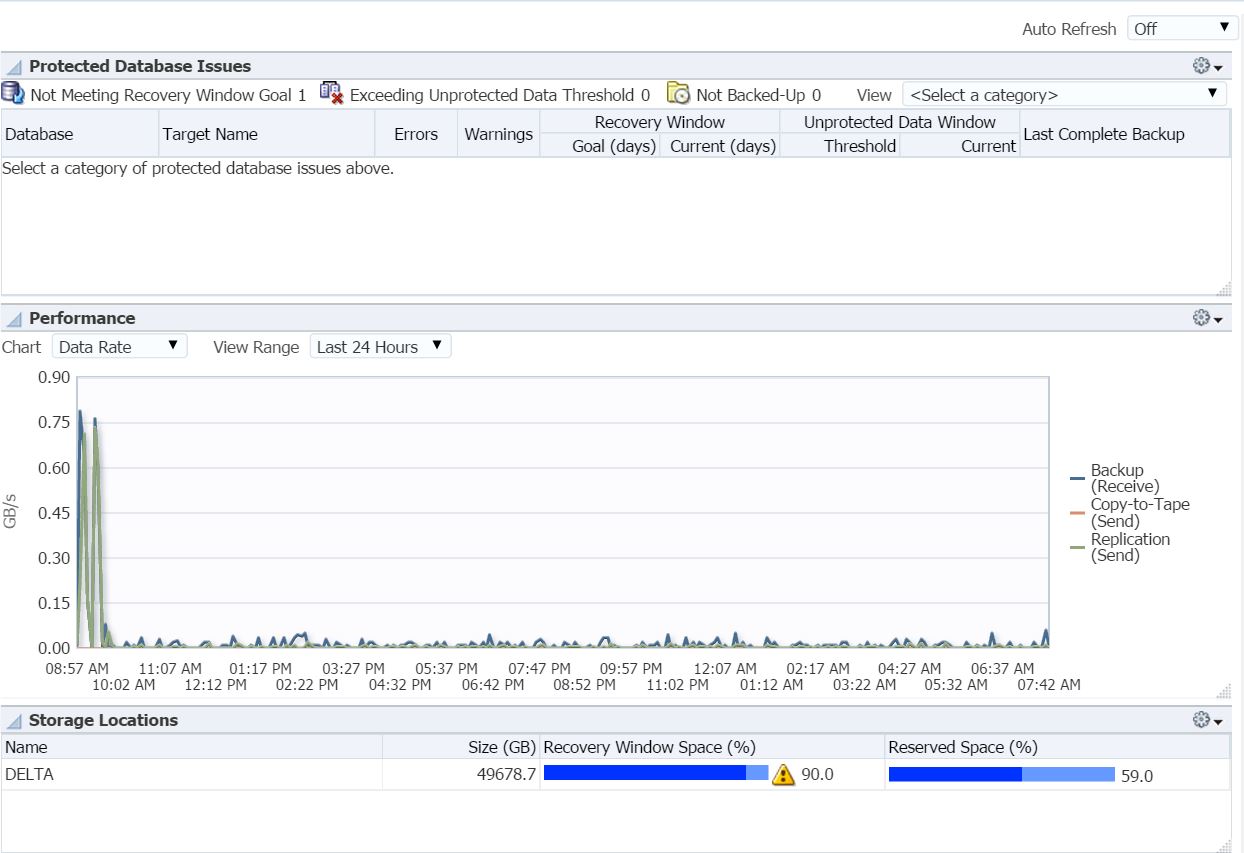
At the lower part of this section, we can view the storage information, including the recovery and reserved space.
Incidents and Events
At the bottom right, we have any incidents and events connected to just the ZDLRA targets. This filter assists the recovery administrator to zero in on the incidents that are important to their responsibility role. There’s no reason to go to the Incident Manager view and filter there, the data is already presenting what is important to them from this dashboard.
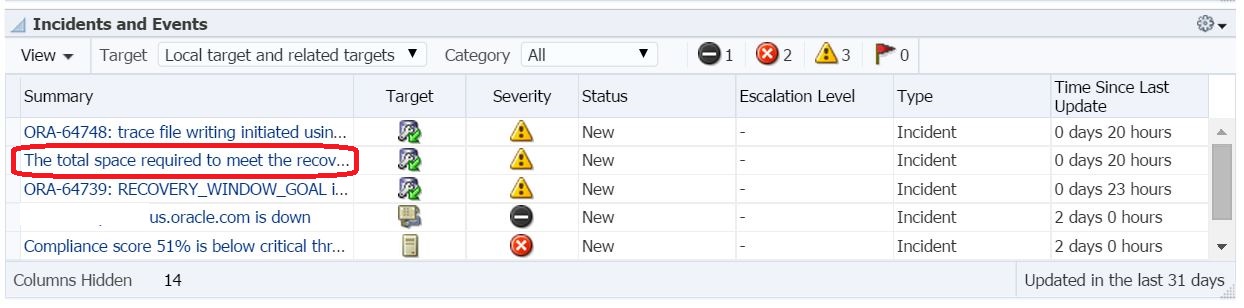
If we were to take the second incident down, “The total space requie to meet the recovery….” We can select this incident and dig into the details about the incident.
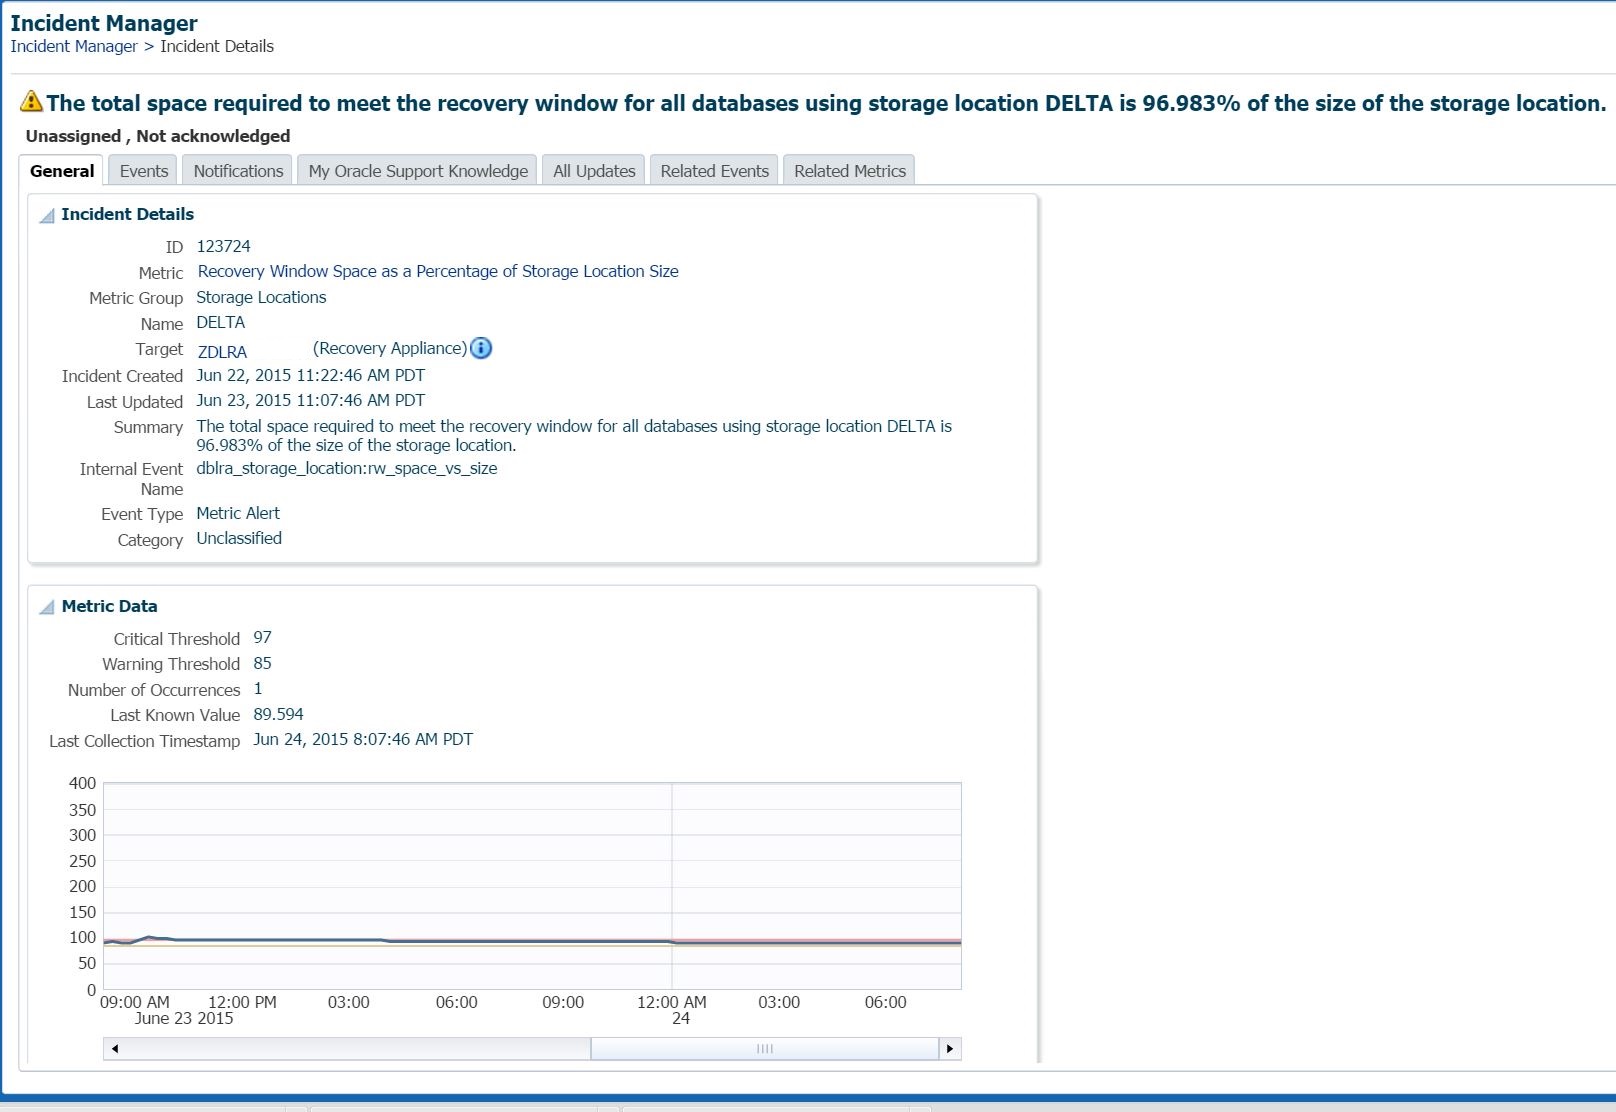
The general information, including thresholds and ability to investigate metric threshold history, etc. is displayed, just as for any incident.
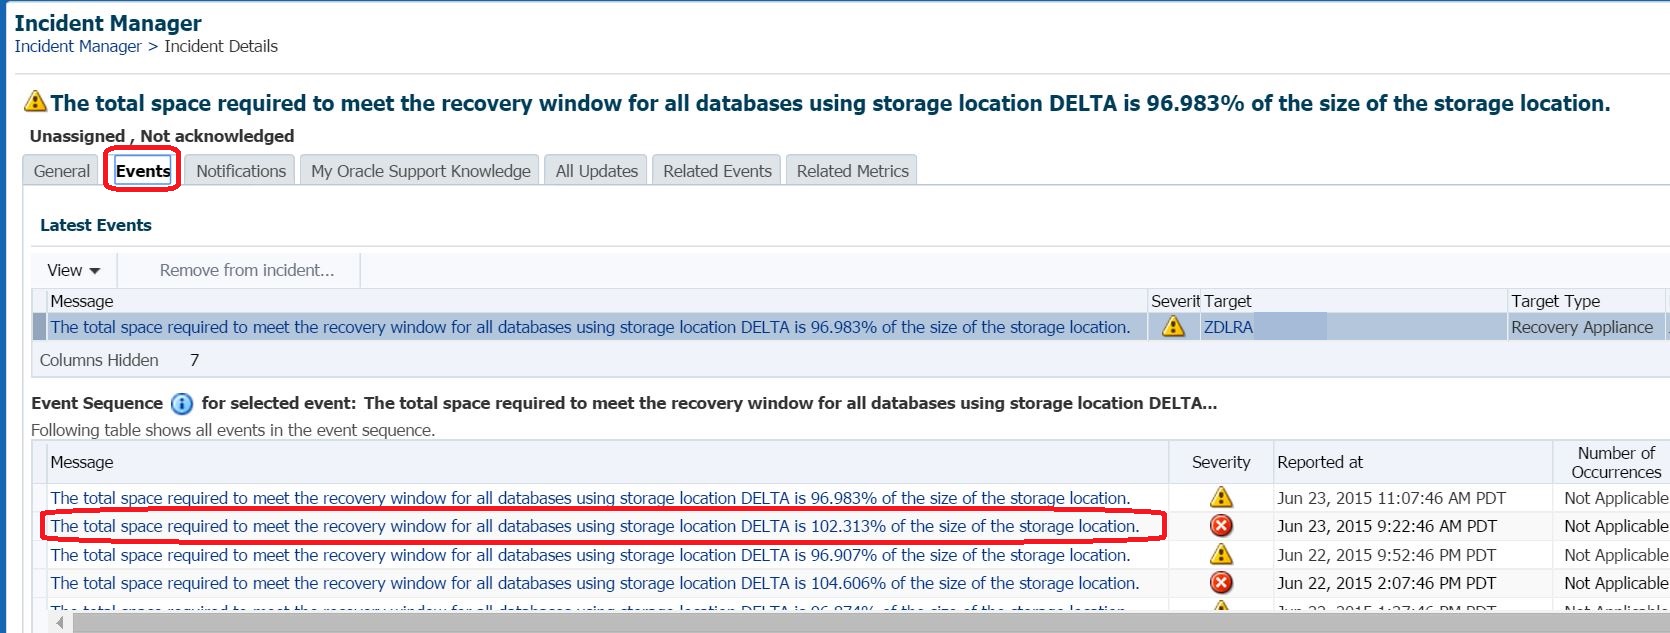
The Events tab shows the history and event sequence as the thresholds were reached during the incident.
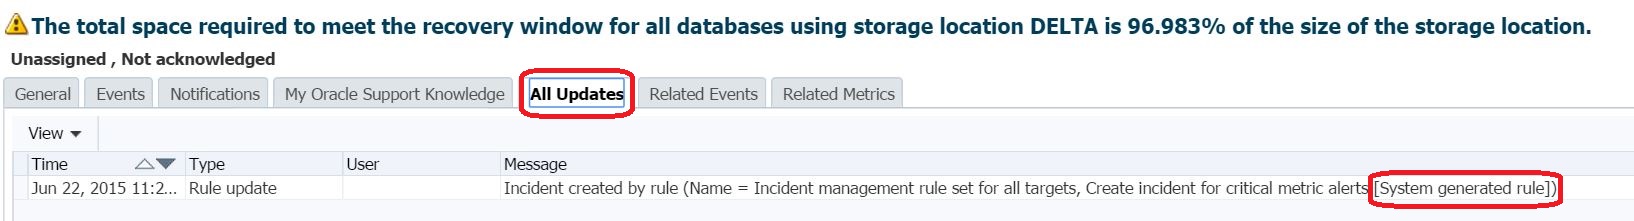
In the All Updates tab, you can see what rule set and that it’s a system generated rule, nothing created by an admin, this came as part of the plugin for space consumption and requirements.
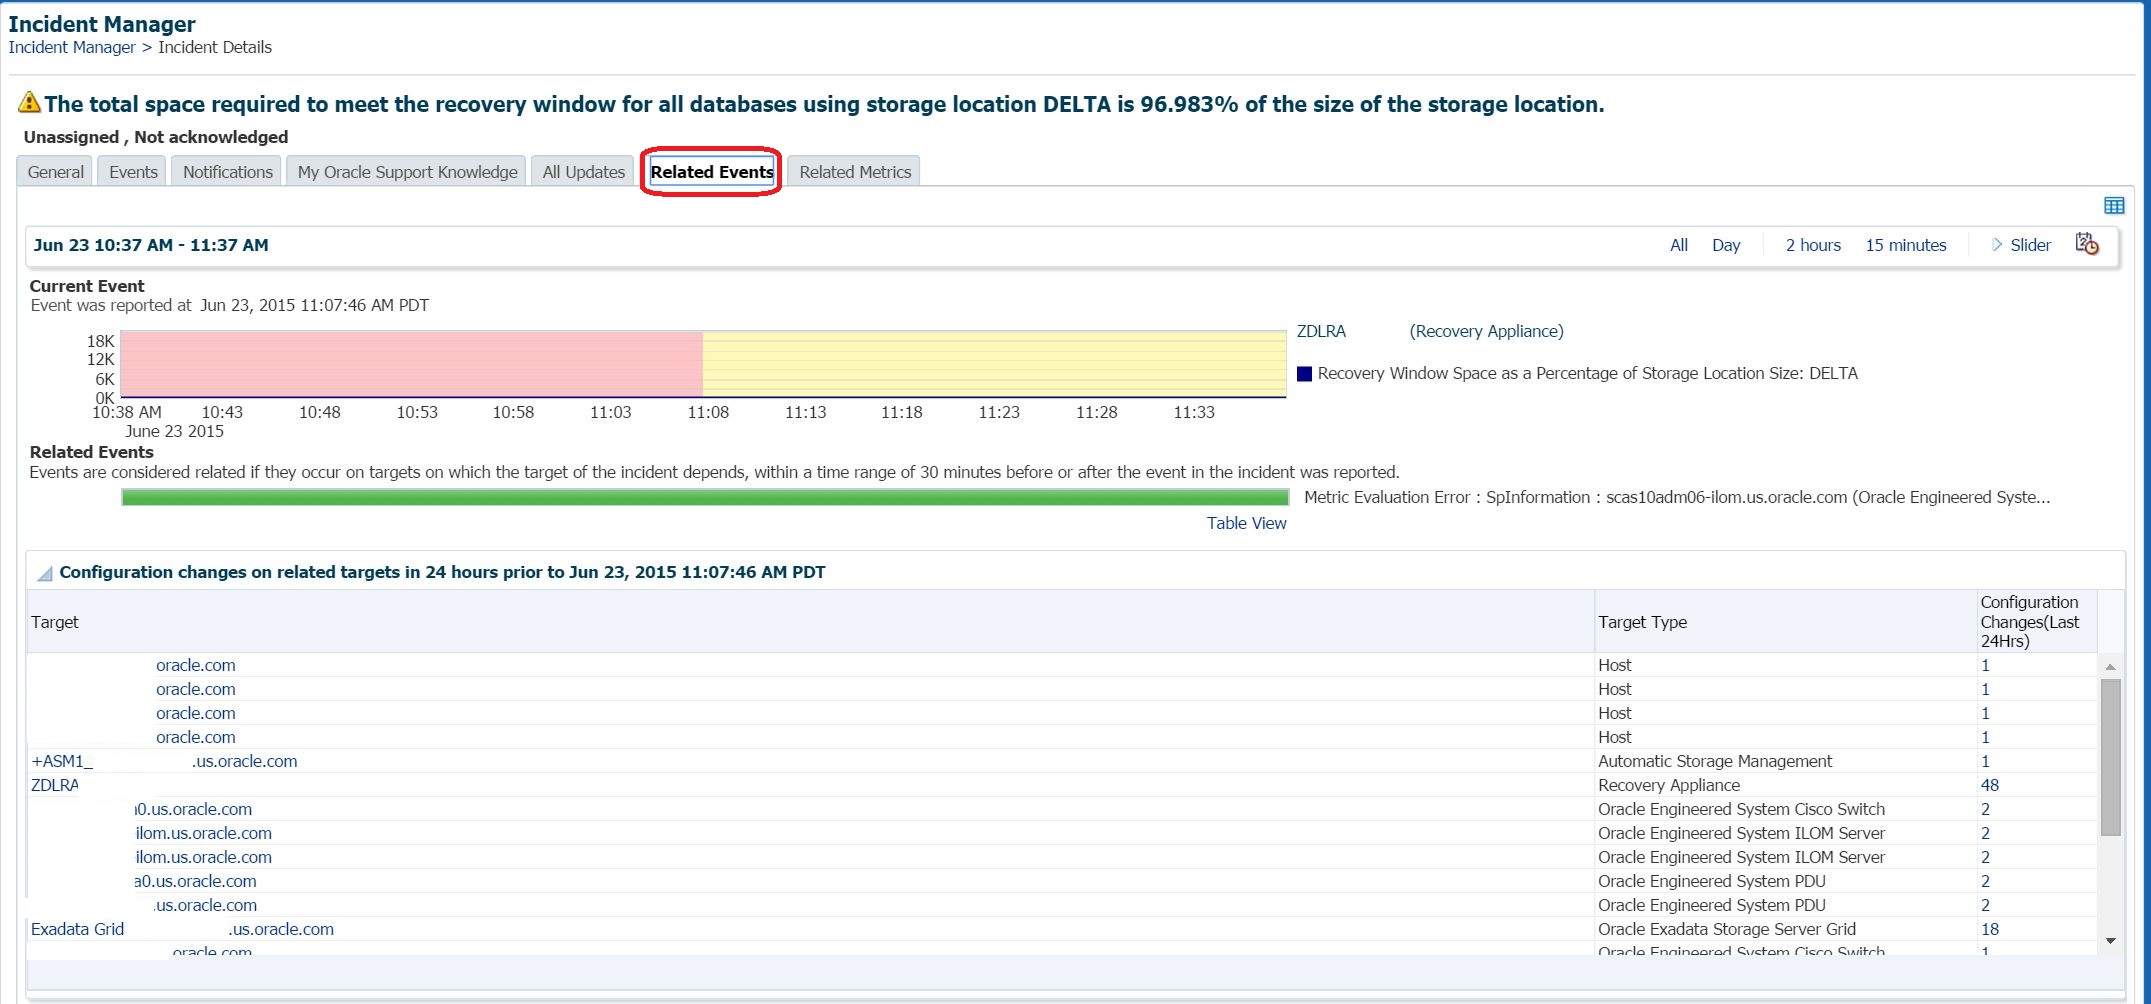
You can then take a look at Related Events and see if any associated targets may be related to the incident, may have caused the incident, etc.
The ZDLRA dashboard within EM12c is clean, provides the important information that you need to know about the backups, any DR configurations/processing, target health and filtered incident management that makes it easy to manage for any DBA. We all know, a DBA is only as good as their last backup and this makes it easy to know you’re good…:)