This is one of about 40 blog posts I’ve been eagerly awaiting for permission to post on the Oracle Management Cloud, (OMC)! There are three main products that will be offered initially through the Oracle Management Cloud–
- Application Performance Monitoring, (APM)
- Log Analytics
- IT Analytics
This post will focus on one area of the third offering of IT Analytics– Database Performance Analytics.
How can advanced IT Analytics investigate database performance at the cloud level vs. on premise? We’ll take a look deeper into this Oracle Management Cloud feature today and hopefully give you just a taste of this incredible upcoming suite of products from Oracle.
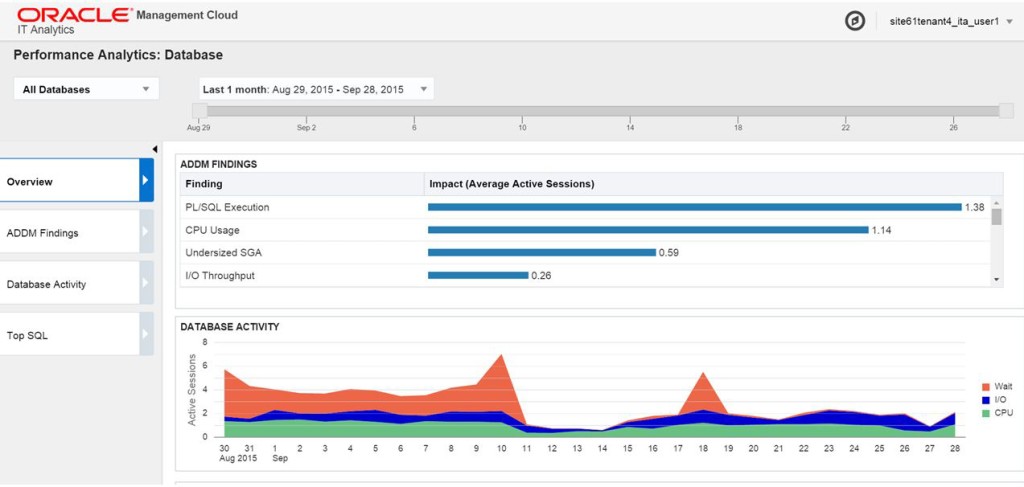
In the IT Analytics Dashboard, we can click on Database and we’ll be brought to the Performance Analytics: Database page. The view, unlike what we are accustomed to in Enterprise Manager, introduces us to a global view of performance activity.
Database Dashboard
Now this may seem very foreign to what the database administrator is accustomed to viewing, but just as one acclimates to viewing performance for any given database, the DBA will acclimate to viewing performance at this new global view. The nuances of performance changes will be noticed soon enough and the DBA will find peace knowing that the global view allows them to inspect their entire database environment vs. just a single one.
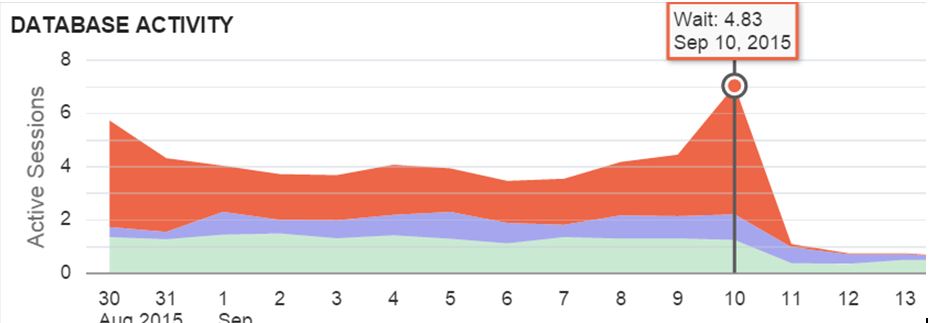
The DBA can focus on any day or performance by hovering their cursor on the Database Activity graph and the overall wait hits will be demonstrated. It’s very clear that on Sept. 10th, a high amount of IO waits were experienced across the database environment.
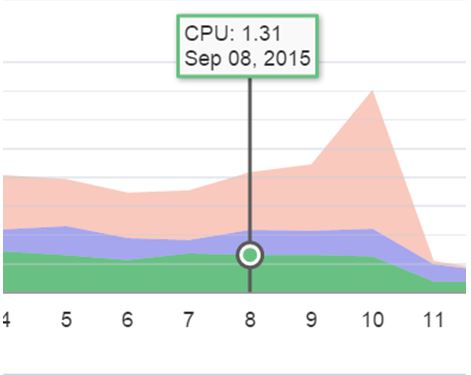
If you were interested in CPU or other wait type, notice that where you hover makes a difference:
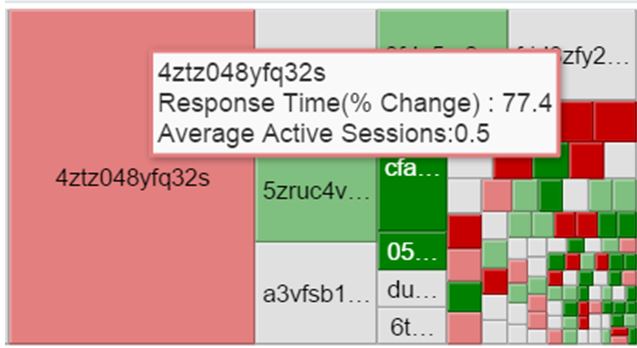
Top SQL
Below the Top Activity, the most impacting SQL is displayed by SQLID and then the change in response time is shown in variations of red to green, red signifying larger percentages of change in performance impact.
This redistributes the tuning exercise from the database level to the global SQL level. Although the SQL identified with ‘bqvs6ypax0dtn’ and ‘gm6py648gu6x5’ may be very good statements for overall tuning, the SQL identified with ‘4ztz048tq32s’ is most likely to result in user complaint due to recent performance degradation from the most number of users.
Now IT Analytics offers incredible opportunities at this global view, but this may be where the DBA wishes to dig into the issue on-premise. IT Analytics Database Performance ensured the DBA was able to quickly identify where their time could be allocated with the most value for a performance tuning exercise and now the DBA may wish to proceed to a trusty AWR SQL specific report or SQL ID details information or Search SQL for the SQLID identified Oracle Management Cloud IT Analytics, thanks to Database Performance Analytics.


