Today’s Post is brought to you by Patrick LeBlanc of Guy in a Cube. I learn best by doing, so I was working with different features while watching along on Quick Measures:
As a newbie, yes, I had problems with my quick measures just as Patrick said I would, but with a twist- It wasn’t that I didn’t want to learn DAX, quite the opposite, I could get the expression to work just fine with DAX, but couldn’t seem to get the hang of the quick measure. Leave it to me to have challenges with the *simpler* method… 🙂
Its always the silliest things that screw you up when you’re learning. The expectation was that I would use the same objects to create my DAX version as my quick measure. I was using two tables:
- Sales[Revenue,Date]
- DateDim[Date]
I created my DAX version:
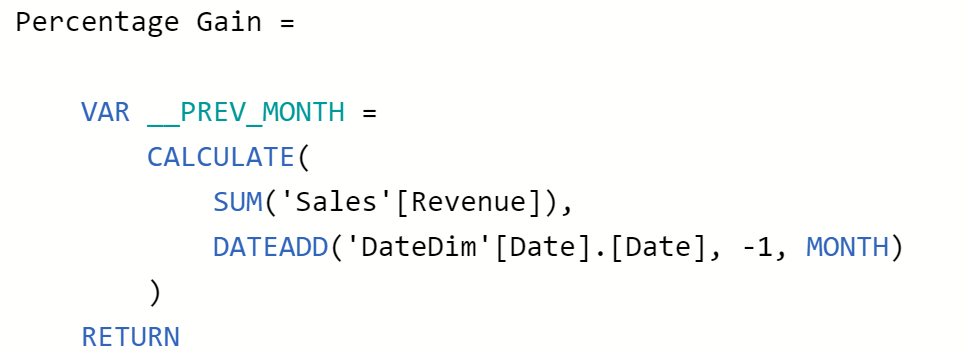
)
No problem. All was good, but then I tried to create my quick measure, I used my Revenue.Date column which doesn’t include the hierarchy of a Power BI date table. It pushed out the error that was expected:
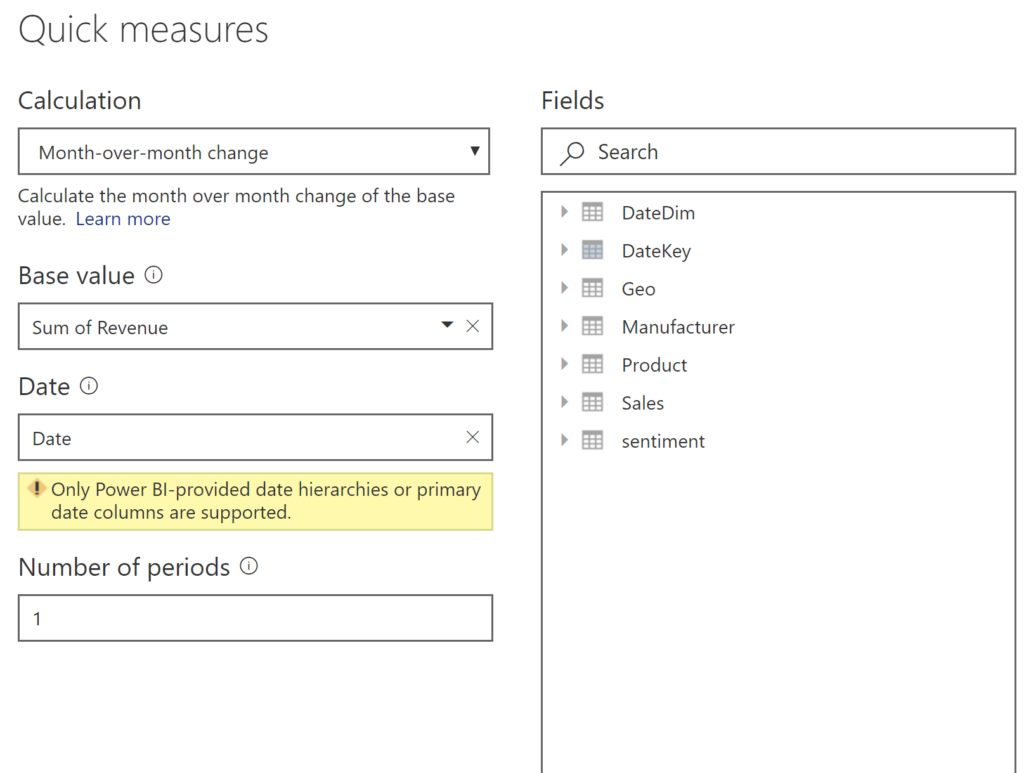
So I chose from the right in the list of table/column options and updated it the quick measure to correctly use the DateDim table:
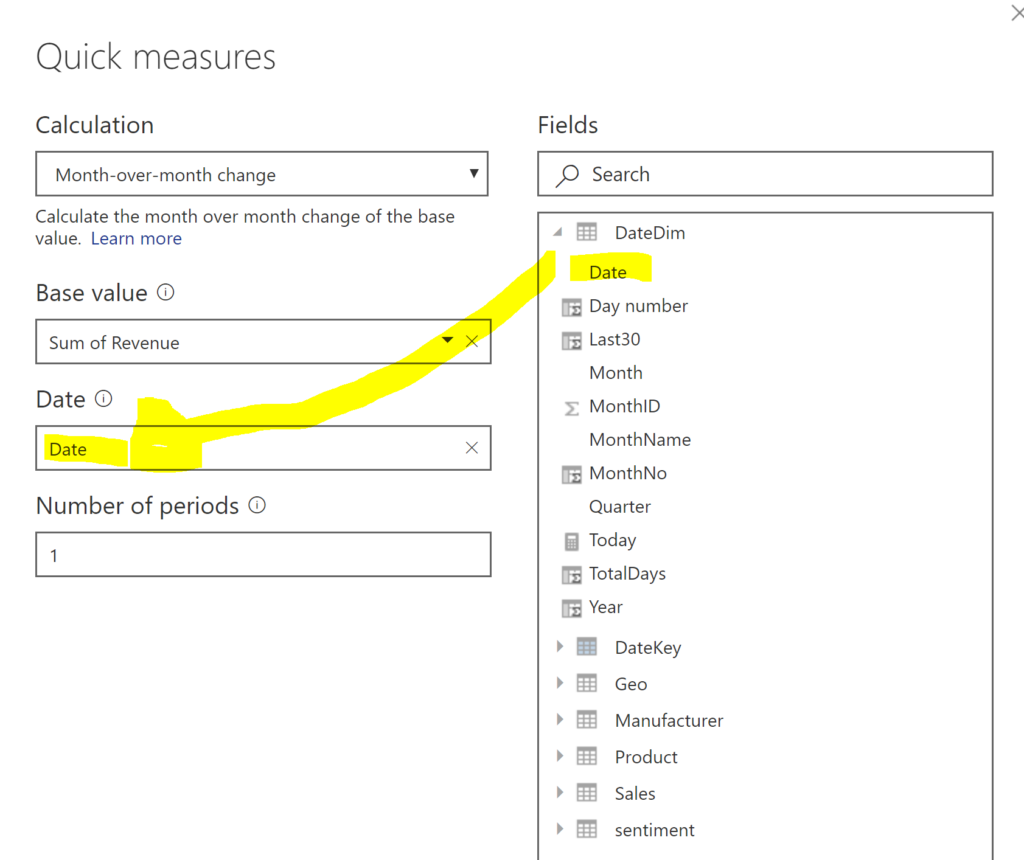
The problem is that it really didn’t fix it as it might so appear. This doesn’t offer me the ability to drill down into the hierarchy that I required for my proper fix, so my quick measure isn’t going to display the data properly for my end visualization.
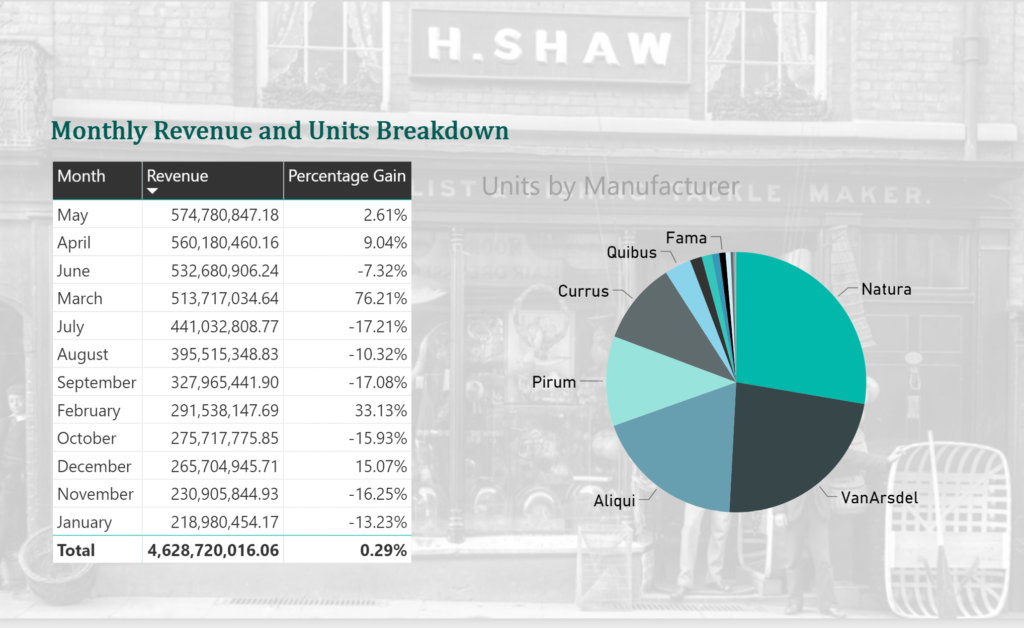
I recreated my quick measure, using the DateDim table with the appropriate hierarchy, then making the change to the DAX that was created by it, (as shown in the video from Patrick). After that, I added another visualization to display a pie chart of units sold per manufacturer, tested out a background image and a few other cool visuals before publishing it.
Not bad…