
Knowing where log files are and how to turn on debugging is an essential part of any technical job and this goes for Power BI, too. Remember, as I learn, so does everyone else….Come on, pretty please?

Power BI Desktop
Log files and traces can be accessed one of two ways-
- Via the Power BI Application
- Via File Explorer
In the Power BI application, go to File –> Options and Settings –> Options –> Diagnostics.
Crash and dump files are automatically stored with an option to disable them from this screen, but unsure why you’d ever want to do this. If Power BI does crash, you would lose any valuable data on what the cause was.
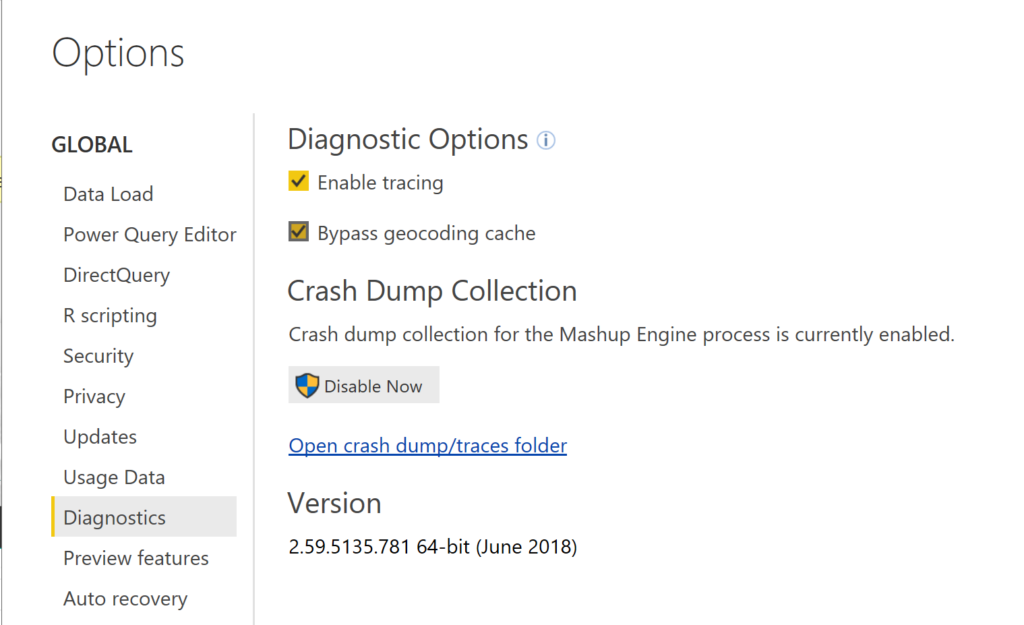
To debug with a trace, you’ll need to enable it from this screen as well, as it’s not turned on by default. Remember that tracing can be both resource and storage intensive, so only enable it when you actually need to diagnose something. You can also choose to bypass tracing the geo code cache, as this is used to help map coordinates and it can be very chatty.
To view files, you can click on the open crash/dump file folder and this will open up a File Explorer to the traces directory on your pc.
Directly From File Explorer:
Ensure that File Explorer has viewing set to display hidden items.
C:\Users\<user>\AppData\Local\Microsoft\Power BI Desktop\Traces
Log Files
These are all retained inside the Performance folder under the Traces directory
The file’s will be named with the following naming convention:
<Usage>.<PID>.<Timestamp><unique identifier>
Locating the files that you need for your current process is easiest if you sort by Date Modified. Verify that you’re working with the file that is being written to and not the file used to keep track of startup and shutdown log tracking, (0 KB):
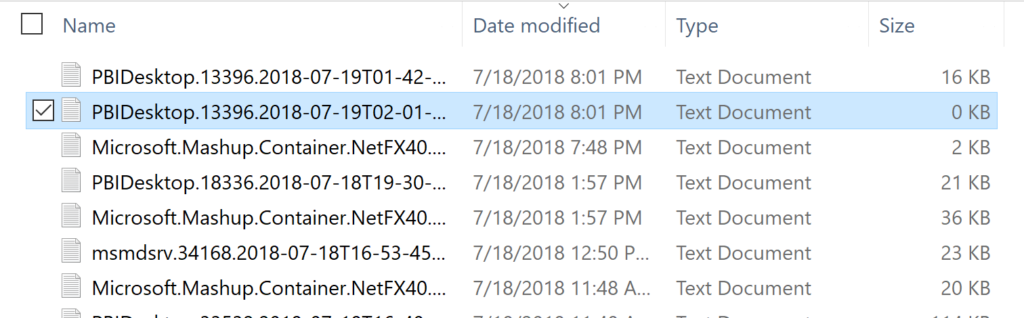
The third log file in the list above, and also the one started before the executable for Power BI Desktop, (PID 13396) is the Microsoft Mashup Container, (Microsoft.Mashup.Container.NetFX40.exe) with its own PID of 16692. It’s contains valuable information about calculations, measures and other caching processes. Take care to ensure the PID of the one used by Power BI in the logs matches the one you’re inspecting in the Task Manager- Excel and other programs are also known to have a version of this executable, so there may be more than one listed for Power BI, as well as others for different Microsoft applications.
Log File Breakdown
Each file will contain entries providing information on high level processing, including start time, total size of cache allocated for the task, process information, Process ID, (PID), Transaction ID, (TID) and duration.
An example of an entry can be seen below:
ObjectCacheSessions/CacheStats/Size {"Start":"2018-07-19T01:42:24.9707127Z","Action":"ObjectCacheSessions/CacheStats/Size","entryCount":"1","totalSize":"24","ProductVersion":"2.59.5135.781 (PBIDesktop)","ActivityId":"00000000-0000-0000-0000-000000000000","Process":"PBIDesktop","Pid":13396,"Tid":8,"Duration":"00:00:00.0046865"}
We can easily match up the Process name and the PID with what is displayed in our Task Manager detail view:
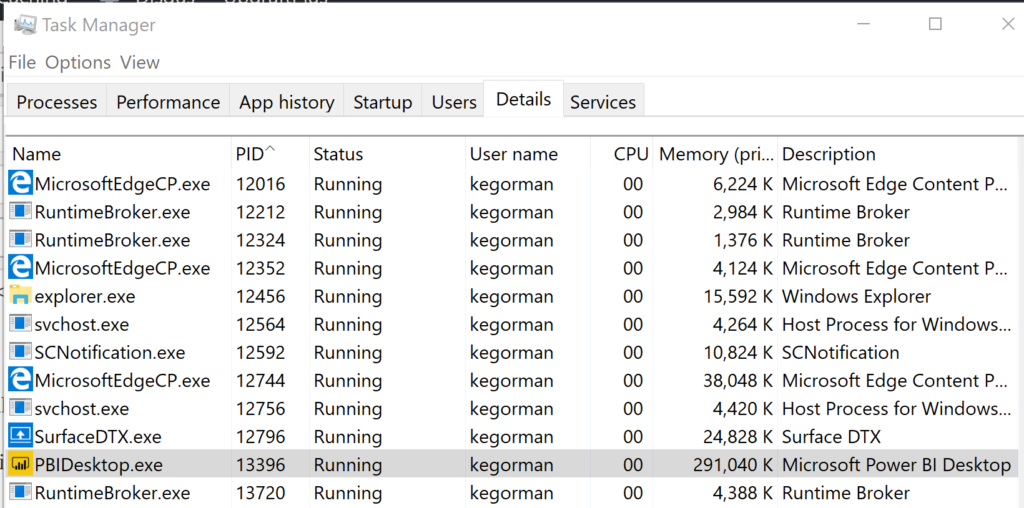
We’ve now identified the process, the amount of memory allocated to perform a task captured in the log, start time and the duration. The information in these log files can assist when diagnosing if Power BI desktop crashes, but the data collected is quite rudimentary.
If you shut down Power BI Desktop, the PBIDesktop* log file writes to the startup file, which was once empty and it then empties and saves off the timestamp of the exit of the program.
The Microsoft Mashup file has much of the same information, but includes deeper level processing work by Power BI, such as work done in the Query Editor or when we create a measure or new column/table.
In the three examples from the file below, you can see a compile, a save and then an evaluate task. Note that the Host Process ID is my Power BI Desktop we’ve seen earlier, but the interaction with the Microsoft Mashup Container is demonstrated as well:
SimpleDocumentEvaluator/GetResult/Compile {"Start":"2018-07-19T01:48:46.1441843Z","Action":"SimpleDocumentEvaluator/GetResult/Compile","HostProcessId":"13396","ProductVersion":"2.59.5135.781 (PBIDesktop)","ActivityId":"04248470-07e1-4862-b184-a32f186f26fd","Process":"Microsoft.Mashup.Container.NetFX40","Pid":16692,"Tid":1,"Duration":"00:00:00.4302569"}

ObjectCache/CacheStats/Size {"Start":"2018-07-19T01:48:47.3504705Z","Action":"ObjectCache/CacheStats/Size","HostProcessId":"13396","entryCount":"5","totalSize":"14564","ProductVersion":"2.59.5135.781 (PBIDesktop)","ActivityId":"04248470-07e1-4862-b184-a32f186f26fd","Process":"Microsoft.Mashup.Container.NetFX40","Pid":16692,"Tid":1,"Duration":"00:00:00.0000170"}

SimpleDocumentEvaluator/GetResult/Evaluate {"Start":"2018-07-19T01:48:46.5744678Z","Action":"SimpleDocumentEvaluator/GetResult/Evaluate","HostProcessId":"13396","ProductVersion":"2.59.5135.781 (PBIDesktop)","ActivityId":"04248470-07e1-4862-b184-a32f186f26fd","Process":"Microsoft.Mashup.Container.NetFX40","Pid":16692,"Tid":1,"Duration":"00:00:00.7780750"}
Another common file in the Performance directory will contain the msmdsrv* naming convention, which collect log information on the data source loader. Duration information and cache/memory allocation could offer valuable information on poor performance during data loading processes. First stop is always to check the settings for the desktop to see what has been set for memory allocation vs. assuming it’s the default.
If I just start the program and don’t open anything, only the high level processing of starting, basic memory allocation and stopping will be tracked in the PBIDesktop* file until I open up a PBIX file. Then anything that needs to be updated and refreshed for the visuals, etc. will begin to write log data to the Microsoft Mashup log file and if a data refresh must be performed, the msmdsrv file.
Trace files
When you do turn on debugging, tracing, as shown in the beginning of this post, a file is created in the parent directory, TRACES.
When enabled and after a restart of the Power BI Desktop, you will receive not only similar information about PID, TID, the process and the duration, but also encounter granule information about Power BI and what’s going on behind the scenes:
- Application graphics info
- Settings
- Parameters
- Background processes
- Caching
- Extensions
- Query edits
- Changes applied
You’ll even see entries similar to the following:
SharedLocalStorageAccessor/AcquireMutex
A mutex is a small, efficient allocation of memory. As mutexes have thread affinity, it means the mutex can only be released by the thread in Power BI that owns it. If it’s released by another thread, an application exception will be thrown in the application and trapped in the trace file.
The interesting aspect of tracing in Power BI Desktop, the options are put back to default, with granule level tracing disabled when you restart the application.
One comment on “Power BI 101 – Log Files and Tracing”
Comments are closed.