I’m curious by nature and many have shown interest when I connect Power BI to the SQL Profiler to collect performance information, but if you can do that, what happens when you connect it to the SQL Server Management Studio, (SSMS)?

That can seem quite foreign, but if you can connect it to the SQL Profiler, you can connect it to the SSMS. Why you can do this is clearly understood when you begin to look underneath the covers of the PBIX file and the processes that run from your desktop.
The PBIX File
All Power BI files end with .pbix. As I and others have written about, you can make a copy of the file, (because we DBAs always like to work from copies vs. the originals) then rename the file from .pbix to .zip. You can then unzip the file and see the base components that make up a Power BI report and visuals:

You now have a breakdown of the DataModel, DataMashup, the Diagram Layouts, the state, the Metadata, Security, Settings and Version. It’s kind of cool to know you can dissect the file once unzipped and make changes to specific features this way, as folks in the community have documented.
The Desktop Processes and Ports
While the Power BI report is open, you’ll see what is running using the netstat -b -n command from the command prompt as an administrator:
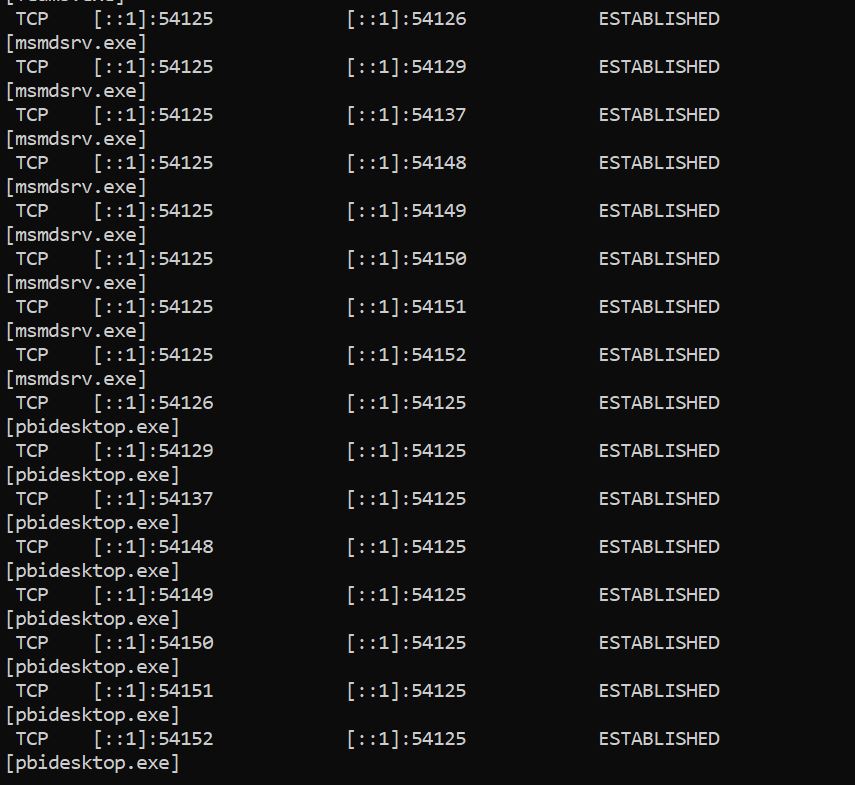
You’ll notice that pbidesktop.exe is port 54125, with multiple child threads. You’ll also notice there is an executable also sourced from the pbidesktop.exe process called msmdsrv.exe. That’s the executable for an Analysis Server. Your data model is being run by trimmed down Analysis Server in Power BI. If you have an Analysis Server port, you can connect to it with SSMS using the ID for Power BI Desktop. In our example above, the ID is 54125 and as the desktop is running on your PC, it would be your “localhost” for the server name. Open up SSMS and update the server type to Analysis Server and I type in the following, using my Active Directory login to connect:
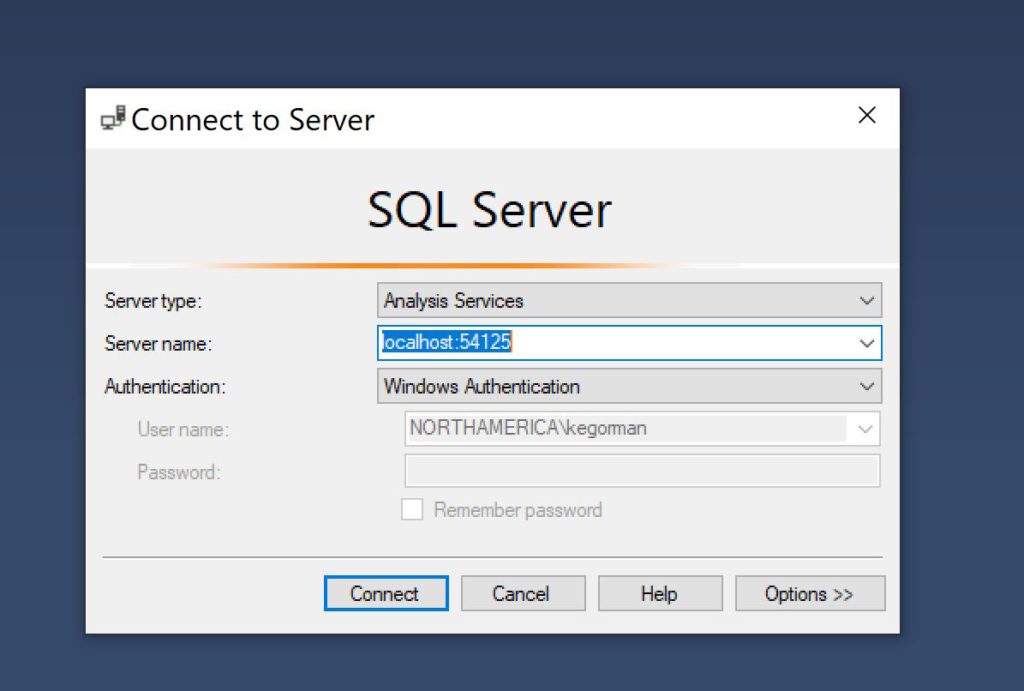
You will connect to the trimmed down Analysis Server behind the PBI Desktop report you have running on your screen and have limited interactive options. If you need proof, here’s the expanded list from SSMS:
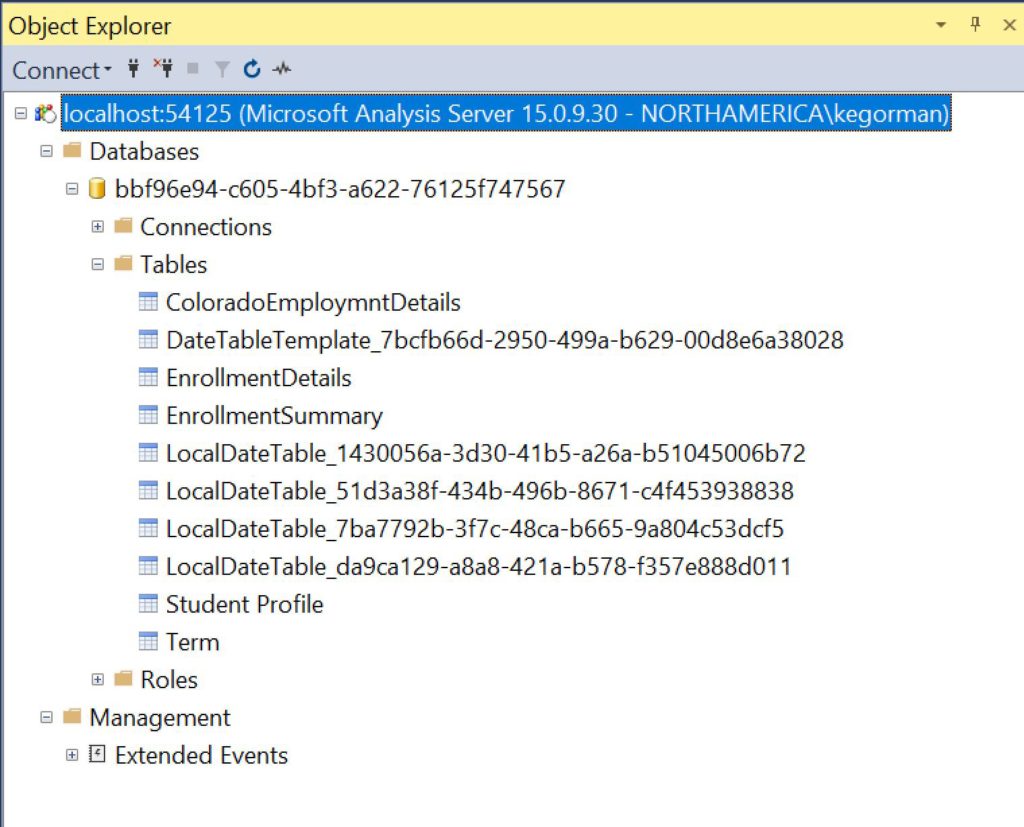
Notice that it matches my list of tables from the Power BI interface for the same report:
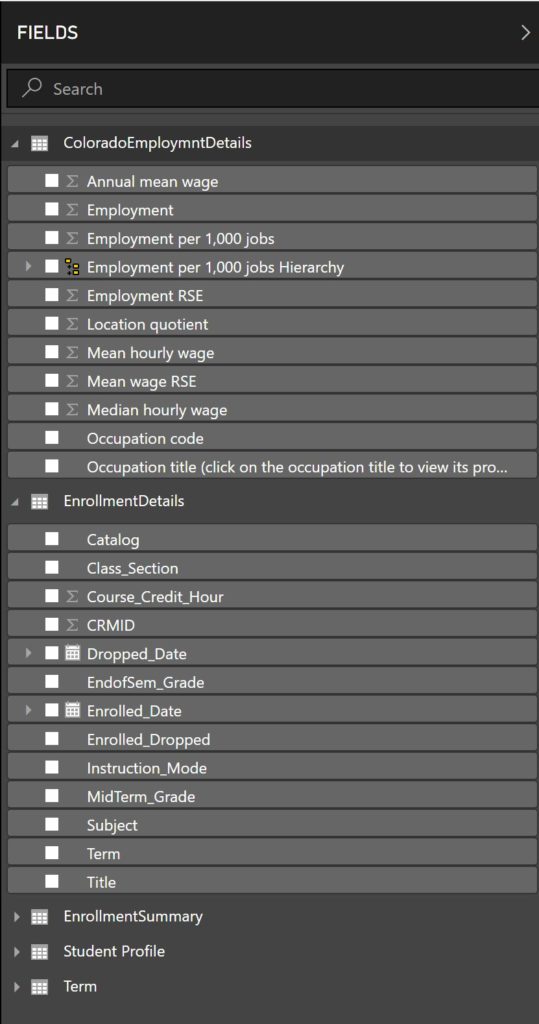
If we expand SSMS interface for the Analysis Server data model further, we can match the columns, calculated columns and measures, as well:
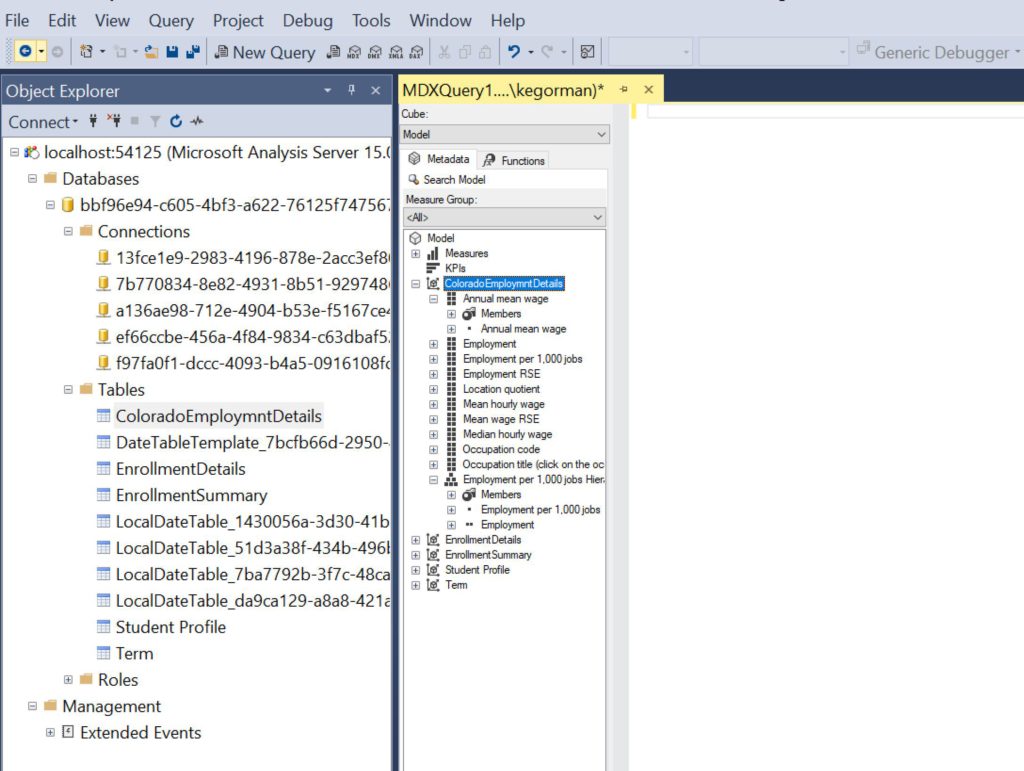
There are limitations- In a full Analysis Server data model, you would be able to execute SQL, MDX, XML and DAX queries. This appears to be disabled from the backend of the PBI data model, which would require you to only perform, at least any DAX and MDX, in the UI of Power BI.

As you can see above, the Execute button is missing from the toolbar and is missing, no matter if you open an XMLA, DAX, MDX and for the SQL Query, you can’t connect to a database engine. The database isn’t a full SQL Server or even appear to be a Windows Internal Database, (WID).
What you can do from here, is connect to the SQL Profiler from the SSMS UI and trace performance for the Power BI report, (data loads, data refreshes, DAX, MDX, etc) along with durations for distributed work to remote data sources.
Well, I hope my little run through Power BI with SSMS was interesting and have a great weekend.

One comment on “Using SSMS with Power BI”
Comments are closed.