
I’ve had a recent request to write an update on working with AWR reports, so as promised, here it is!
The Automatic Workload Repository
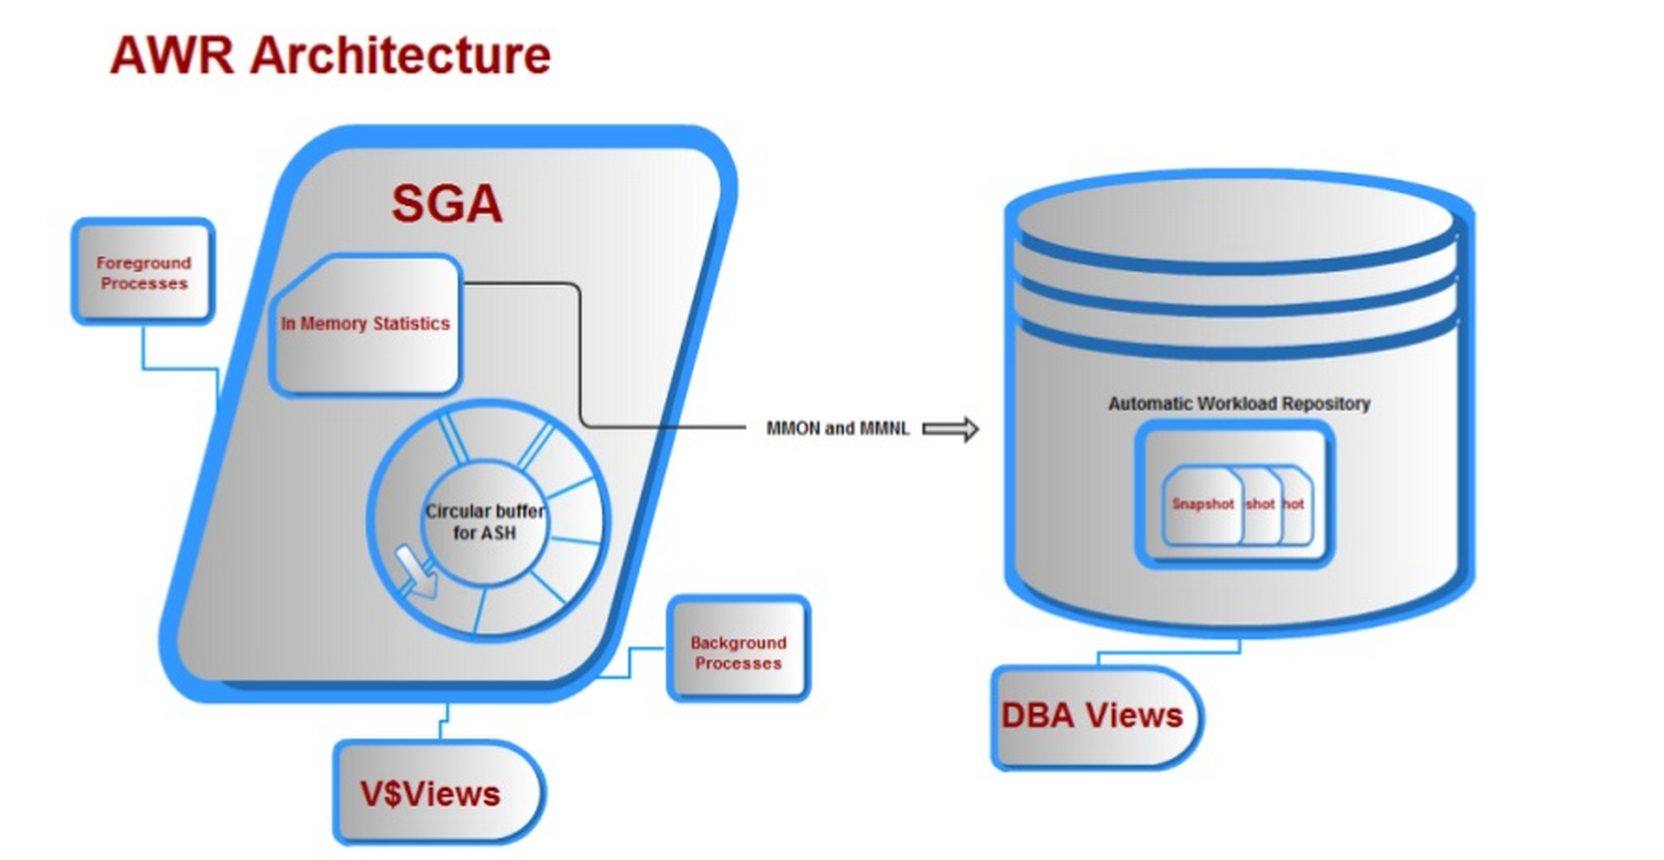
The Automatic Workload Repository, (AWR) was one of the best enhancements to Oracle back in release 10g. There was quite a goal put in front of the development group when they were asked to develop a product that:
1. Provided significant performance recommendation and wait event data enhancements over its predecessor statspack.
2. Was always on, meaning that the data would continually collect without manual intervention from the database administrator.
3. Wouldn’t impact the current processing, having its own background processes and memory buffer, designated tablespace, (SYSAUX).
4. The memory buffer would write in the opposite direction vs. direction the user reads, eliminating concurrency issues.
Along with many other requirements, all of the above was offered with the Automatic Workload Repository and we end up with architecture that looks something like this:
Using AWR Data
The AWR data is identified by the DBID, (Database Identifier) and a SNAP_ID, (snapshot identifier, which has an begin_interval_time and end_interval_time to isolate the date and time of the data collection.) and information about what is currently retained in the database can be queried from the DBA_HIST_SNAPSHOT. AWR data also contains ASH, (Active Session History) samples along with the snapshot data, by default, about 1 out of every 10 samples.
The goal to using AWR data effectively really has to do with the following:
1. Have you identified a true performance issue as part of a performance review?
2. Has there been a user complaint or a request to investigate a performance degradation?
3. Is there a business challenge or question that needs to be answered that AWR can offer an answer to? (we’ll go when to use AWR vs. other features…)
Performance Review
A performance review is where you have either identified a problem or have been assigned to investigate the environment for performance issues to solve. I have a couple Enterprise Manager environments available to me, but I chose to go out to one in particular and cross my fingers hoping I would have some heavy processing to fit the requirements of this post.
The quickest way to see workload in your database environment from EM12c, click on Targets –> Databases. Choose to view by load map and you will then view databases by workload. Upon going to a specific Enterprise Manager environment, I found out it was my lucky day!
 I really don’t know who Kurt is that has a database monitored on this EM12c cloud control environment, but boy, is he my favorite person today! 🙂
Hovering my cursor over the database name, (kurt) you can view the workload he has running on his test database currently: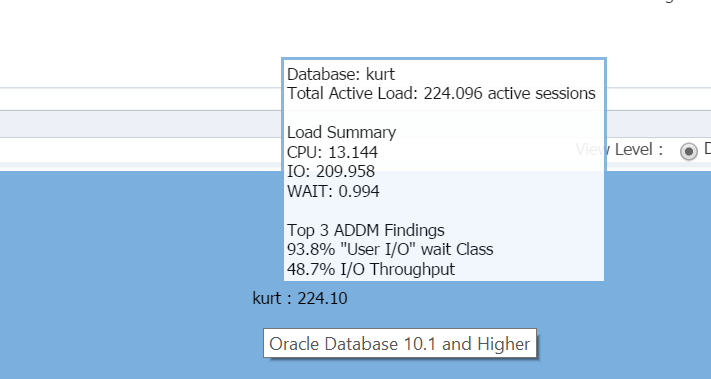
Boy, is Kurt my favorite person today!
EM12c Database Home Page
Logging into the database, I can see the significant IO and resource usage for the database and host from the database home page:

If we move to Top Activity, (Performance menu, Top Activity) I begin to view more details about the processing and different wait events:

Kurt is doing all KINDS of inserts, (seen by the different SQL_IDs, by SQL Type “INSERT”. I can drill down into the individual statements and investigate this, but really, there are a TON of statements and SQL_ID’s here, wouldn’t it just be easier to view the workload with an AWR report?
Running the AWR Report
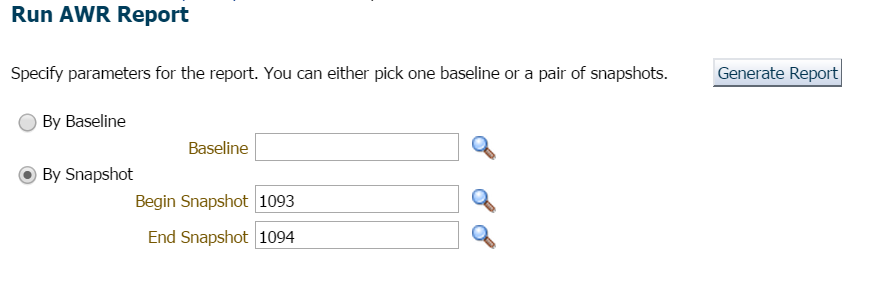
I choose to click on Performance, AWR, AWR Report. Now I have a choice. I could request a new snapshot to be performed immediately or I could wait till the top of the hour, as the interval is set hourly in this database. I chose the latter for this demonstration, but if you wanted to create a snapshot immediately, you can do this easily from EM12c or request a snapshot by executing the following from SQLPlus with a user with execute privileges on the DBMS_WORKLOAD_REPOSITORY:
BEGIN
DBMS_WORKLOAD_REPOSITORY.CREATE_SNAPSHOT ();
END;
/
For this example, I simply waited, as there was no hurry or concern here and requested the report for the previous hour and latest snapshot:
I always start at the Top Ten Foreground Events and commonly look at those with high wait percentages:
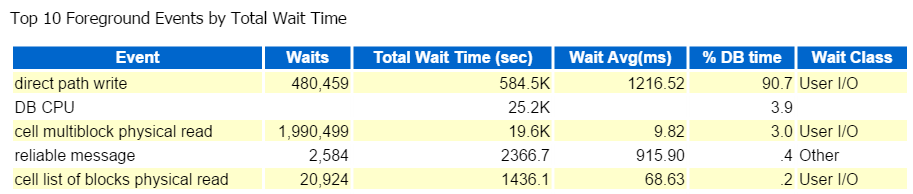
Direct Path Write, that’s it. Nothing else to see here… 🙂
Direct path write involves the following: inserts/updates, objects being written to, tablespaces being written to and those datafiles that make up the tablespace(s).
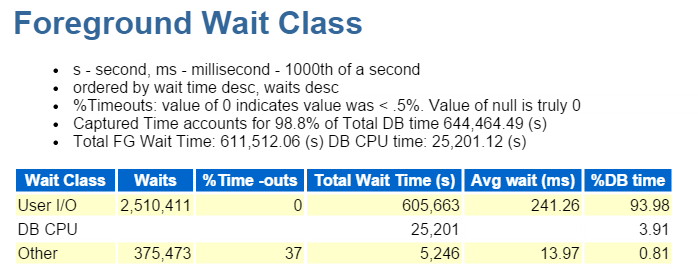
It’s also IO, which we quickly verify down in the Foreground Wait Class:
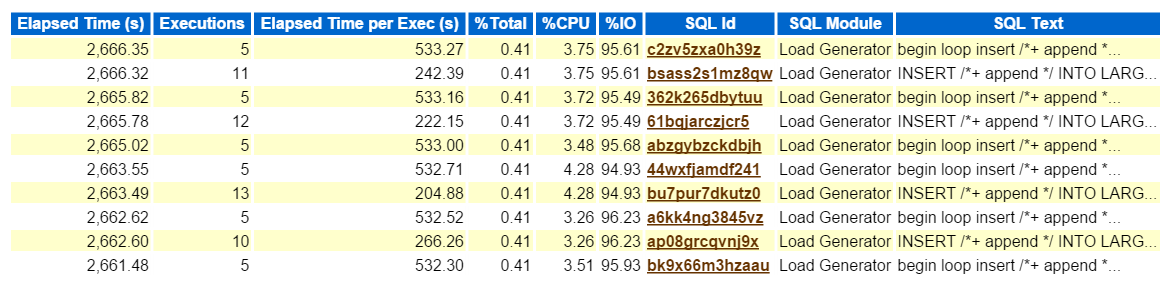
Looking at the Top SQL by Elapsed Time confirms that we are dealing with a workload consisting of all inserts:
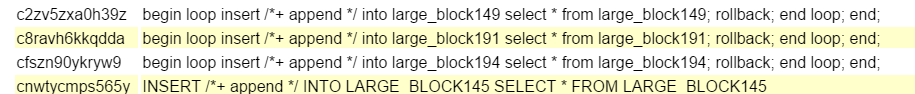
Clicking on the SQL ID, takes me to the Complete List of SQL Text and shows me just what Bad Boy Kurt is doing to produce his testing workload:
Wow, that Kurt is quite the rebel, eh? 🙂
Insert in a loop into one table from the same table, rollback and then end the loop, thanks for playing. He’s kicking some tires and doing it with angst! Don’t worry people, like I said, Kurt is doing his job, using a module called “Load Generator”. I’d be a fool not to recognize this as anything other than what it is- generating workload to test something. I just get the added benefit of having a workload to do a blog post on using AWR data… 🙂
Now, if this was a real issue and I was trying to find out what this type of performance impact this type of insert was creating on the environment, where to go next in the AWR report? The top SQL by elapsed time is important as it should be where you focus your efforts. Other sections broken down by SQL is nice to have, but always remember, “If you aren’t tuning for time, you’re wasting time.” Nothing can come of an optimization exercise if no time savings is seen after you’ve completed the work. So by taking first the Top SQL by Elapsed Time, then looking at the statement, we now can see what objects are part of the statement, (large_block149, 191, 194, 145).
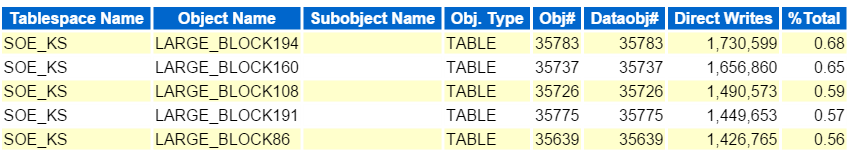
We also know that the problem is IO, so we should jump down from the SQL detailed information and go to the object level information. These sections are identified by Segments by xxx.
- Segments by Logical Reads
- Segments by Physical Reads
- Segments by Read Requests
- Segments by Table Scans
so on and so forth….
These all show a very similar pattern and percentage for the objects we see in our top SQL. Remember, Kurt was reading each of these tables, then inserting those same rows back into the table again, then rolling back. As this is a workload scenario, unlike most performance issues I see, there is no outstanding object showing with an over 10% impact in any area.
As this is an Exadata, there is a ton of information to help you understand offloading, (smart scans) flash cache, etc. that will assist in relaying the information you need to make sure you are achieving the performance you desire with an engineered system, but I’d like to save that for another post and just touch on a few of the IO reports, as we were performing table scans, so we do want to make sure those were being offloaded to the cell nodes, (smart scans) vs. being performed on a database node.
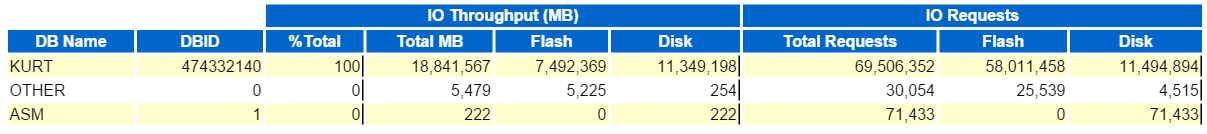
We can start by looking at Top Database IO Throughput:
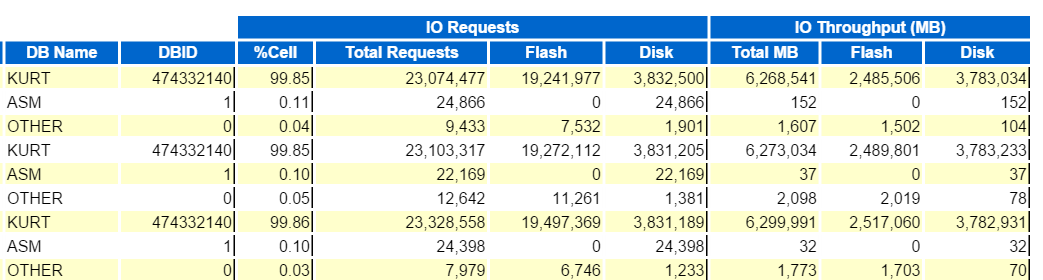
And then view the Top Database Requests Per Cell Throughput, (sans the Cell node names) to see how they compare:
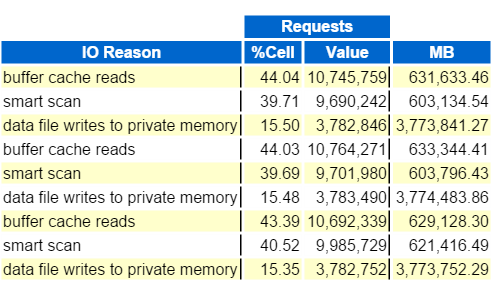
Then we add to it this last graph that tells us, are we offloading enough of the workload to each of the cell nodes, Top IO Reasons by Request?
This has been one scenario trip through an AWR Report. Hopefully it’s been interesting and next time I’ll search for a different load type to take you through!
Happy Friday!

Saw your discussion 4/28/2017 in Dallas at DOUG. There were some slides you referred to that you didn’t have with you on that Thursday afternoon. Are those here on this page? Can they be downloaded in a .pdf or other format for easy printing?
Hi Jimmy…I’m a little concerned about the pocket knife, but we’ll let that slide this time… 🙂
Please consider downloading the following slide deck- https://www.slideshare.net/kellynpotvin/awr-ash-with-em13-at-hotsos-2016
I’d also click on the top of the page that says, “Scripts & Questions” and look in the AWR Warehouse queries and the ASH queries. I can’t remember the exact details of what you were looking for, but I think it was around “per SQL_ID” and these scripts focus on that area. If they aren’t exact, you should be able to quickly update them to work on a non-AWRW and collect what you need.
Thanks for coming out for the sessions last night!
Kellyn