
The term “Service” is used to represent numerous objects within Enterprise Manager 12c. Although the most common reference to the term is related to the Oracle Management Service, (OMS), in this blog post, we are going to drill down and refer to all services identified in the drop down menu from Targets, Management Services and Repository.
The two main services we are going to cover here are set up as part of the Oracle Enterprise Manager 12.1.0.4 installation and shouldn’t be edited or reconfigured, but I think it’s good to know where everything is if you should ever need to investigate it or are working with Oracle Support.
By default the following services will display in the EM12c environment-
- EM Console Service
- EM Job Service
These two services are essential to successful Enterprise Manager task completion. The EM Console Service is the service that keeps the console active and accessible and the EM Job Service controls not just the EM Jobs viewable in the EM Job Activity console, but also a ton of background processing for the Enterprise Manager.
The Main Console View
Once you’ve accessed the services from the target menu, as these are both monitored targets in the Enterprise Manager, you’ll see the following information:
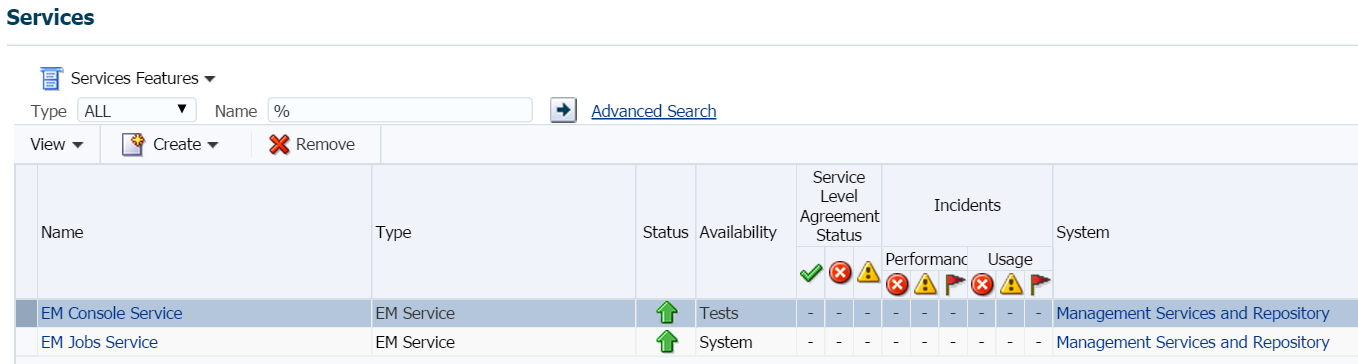
Along with the two, default services we expect to see for a standard Enterprise Manager installation, we also can see the status, if there are any open incidents and what system the services belong to. You can create and remove services from here, but unless you know what you’re doing, this is mostly the view to quickly filter service information.
Creating services from this console offers you three, two generic service types and one advanced service option called an Aggregate service.
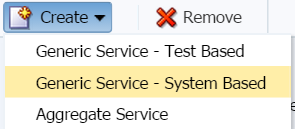
Using our existing services as examples, it may give you a bit of an idea of how a System Based service is different than a Test Based one.
A System based service monitors one single system vs. a Test based one, which monitors a one or more test based systems. Notice that the EM Jobs Service does ONE thing- it monitors the Enterprise Manager Job Service. The EM Console Service has to monitor EVERYTHING that is involved in the console, which is much more complex and requires a constant test to ensure all aspects are available.
And Aggregate Service is a combination of sub-services. If one of the many sub-services is experiencing an issue, the entire Aggregate service is dependent upon that one failure.
There are a number of other services that Enterprise Manager 12c supports:
- Business Application
- Service Entry Point
- Oracle Database Service
- Oracle Applications Service
- Siebel Services
- Beehive Services
- EM Service
- And others….
You can create, manage and remove services via EM CLI commands, too. The following commands will support the management of each:
- create_service
- assign_test_to_target
- change_service_system_assoc
- remove_service_test_assoc
- set_availability
- set_properties
- And many, many others….
To the right of the console list of services, are Key Components incident information. This can assist the administrator when they are experiencing a problem, but the culprit isn’t displayed in the service, a related target may be the issue:
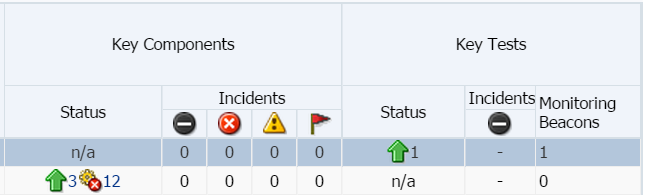
The Key Tests also show current status and any monitoring beacons that are attached to the service.
EM Console Service
If we click on the EM Console Service, we are taken to the home page for the service.
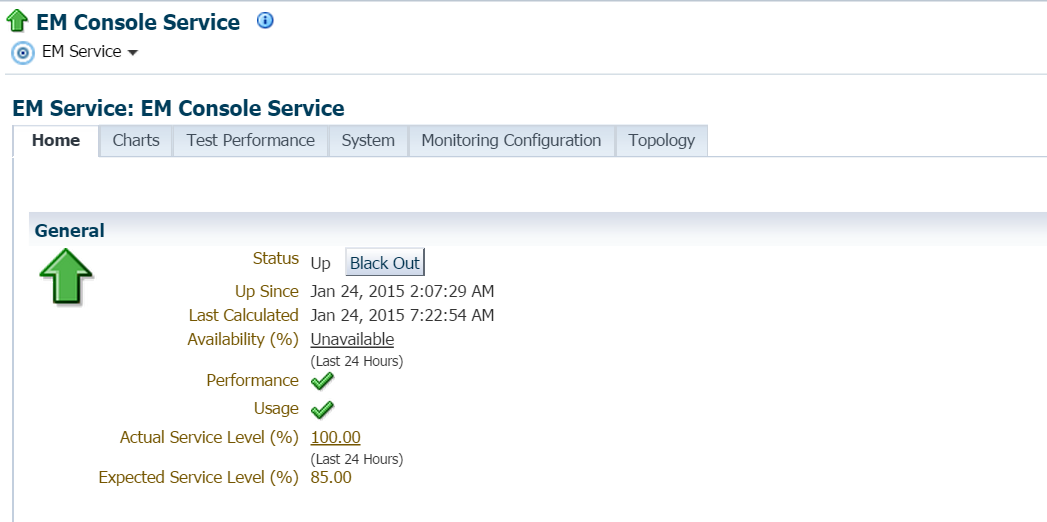
Centering in on the upper, left section of the home page, you notice that there are a number of tabs:
- Home
- Charts
- Test Performance
- System
- Monitoring Configuration
- Topology
For any generic service, you are going to see these tabs, but we’ll go through each one of the tabs, (outside of the home tab) for the EM Console Service so that you get a good feel for what is available in each and what tab has control over the configuration of the service.
Charts
Upon clicking the charts menu, you’ll see the basic information about page response per millisecond and page hits per minute:
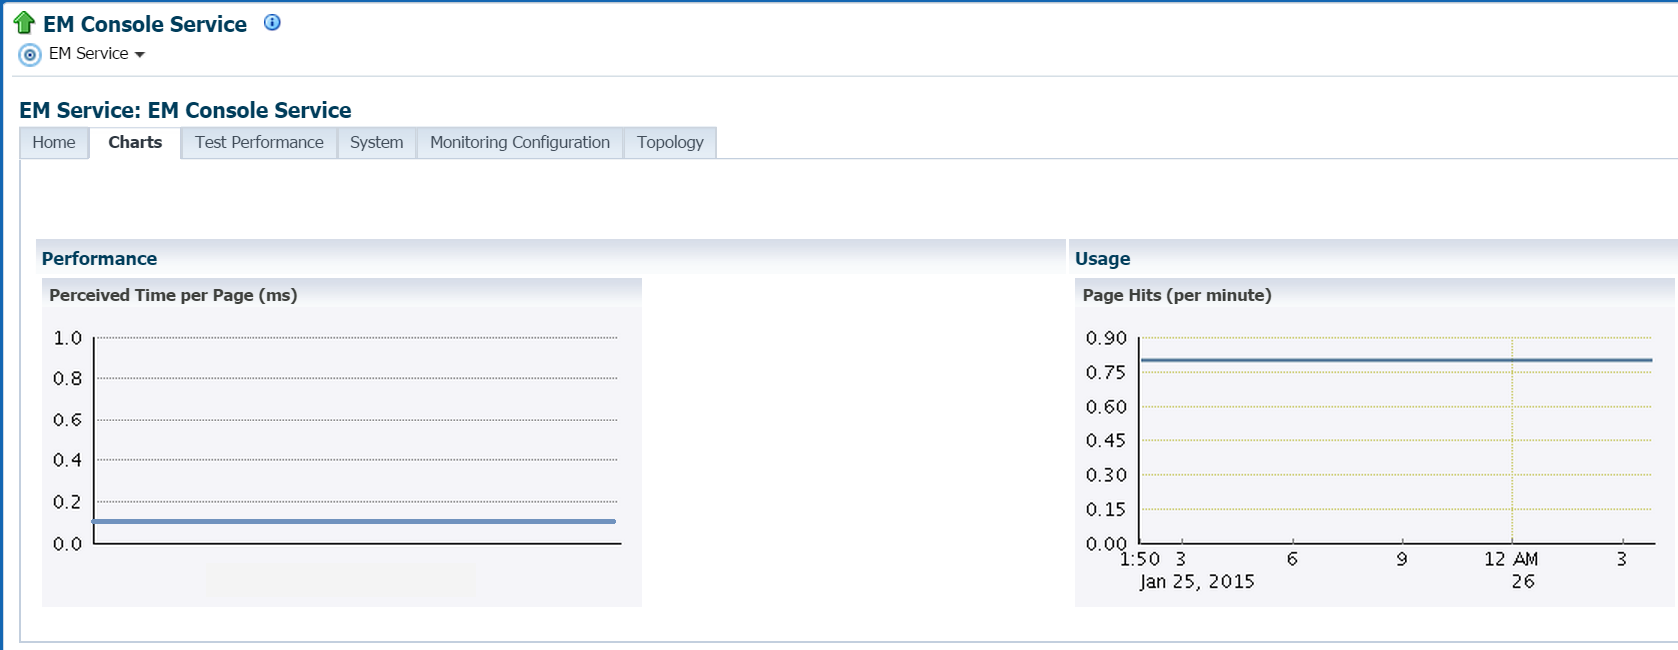
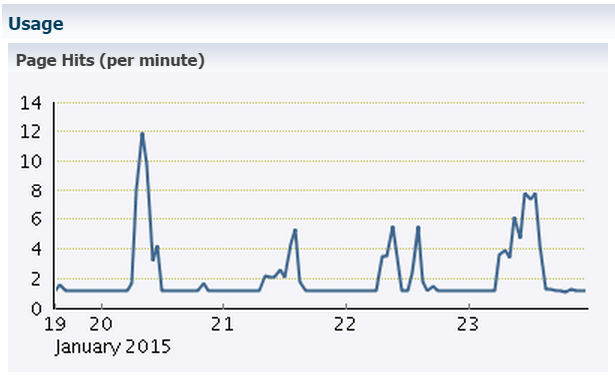
Unless there is a serious performance issue in the console, I commonly don’t find a lot of useful data from the default view of “last 24 hrs” and recommend changing the view to [at least] the last 7 days. You’ll be surprised how different the data will look when you take into account the nightly maintenance jobs that keep EM12c clean and effective:
Test Performance
The next tab is for test performance. All services have tests involved that check and see if a service is actively running and passes either one or more tests that verify it is properly functioning and available.
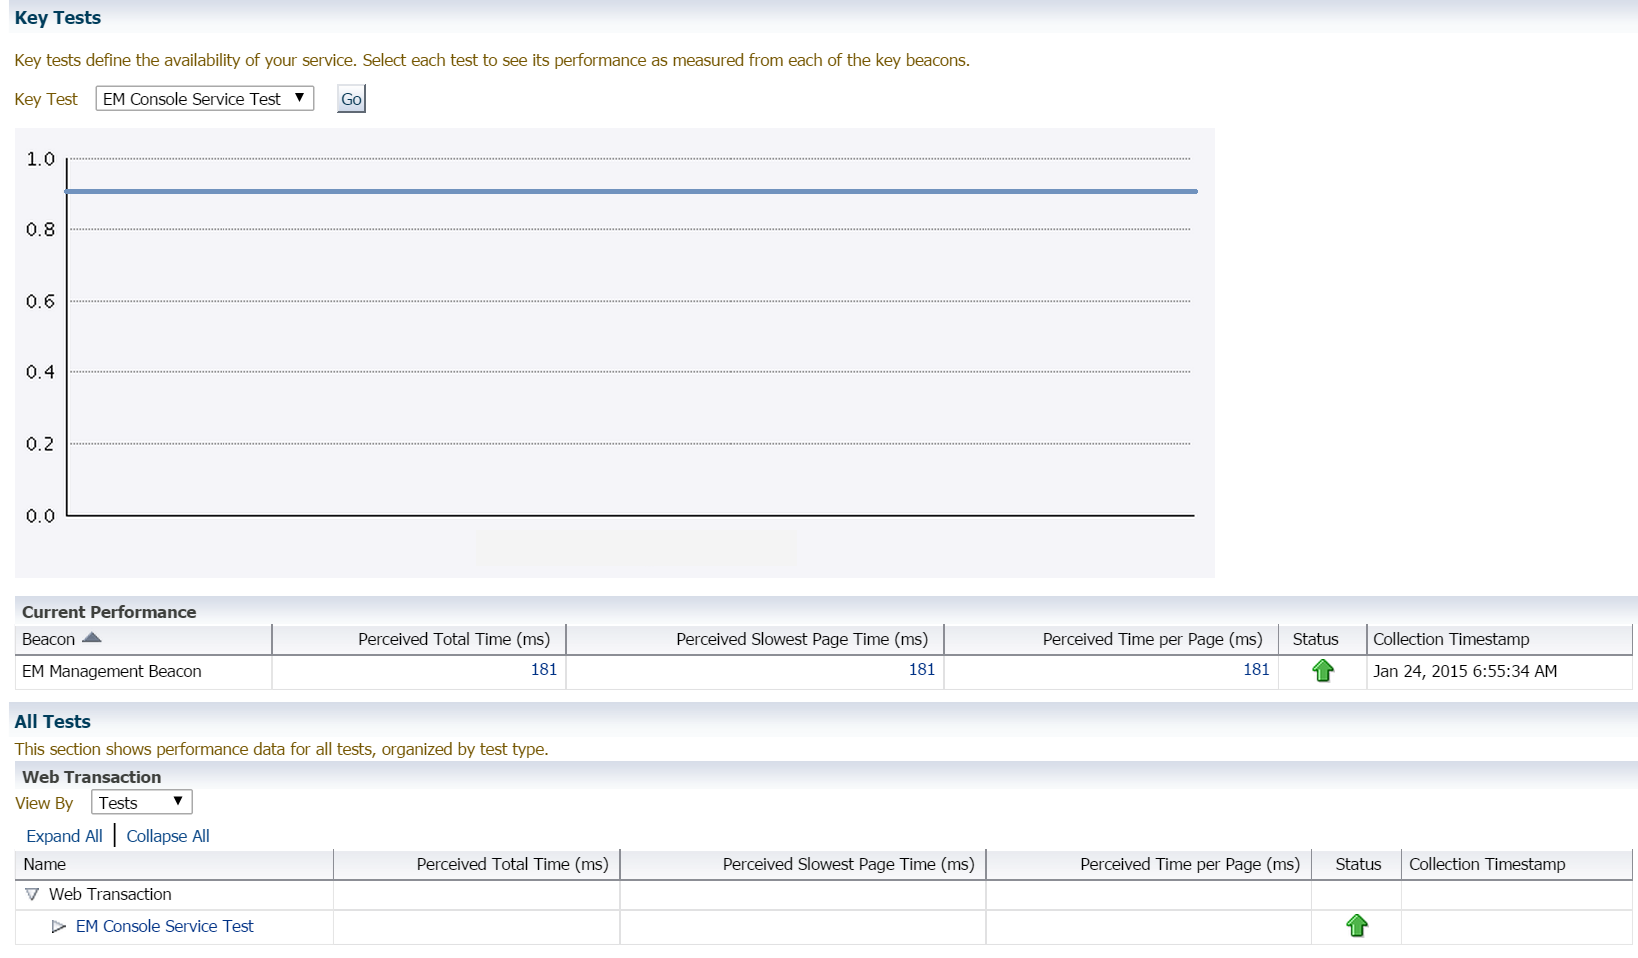
The value for the last EM Console Service Test is shown above in the graph, but the real information lies lower in the performance timestamp. The test isn’t run very often, (it is a performance impact to the system, so full testing of the service is only run once every 24 hours.) You can see the Collection Timestamp in the right hand window of 6:55am, which will also match the extended Web Transaction used to verify that the console is accessible if you click on the EM Console Service Test at the bottom.
System
The System tab displays the latest information about the status and incidents of the components connected to the service. 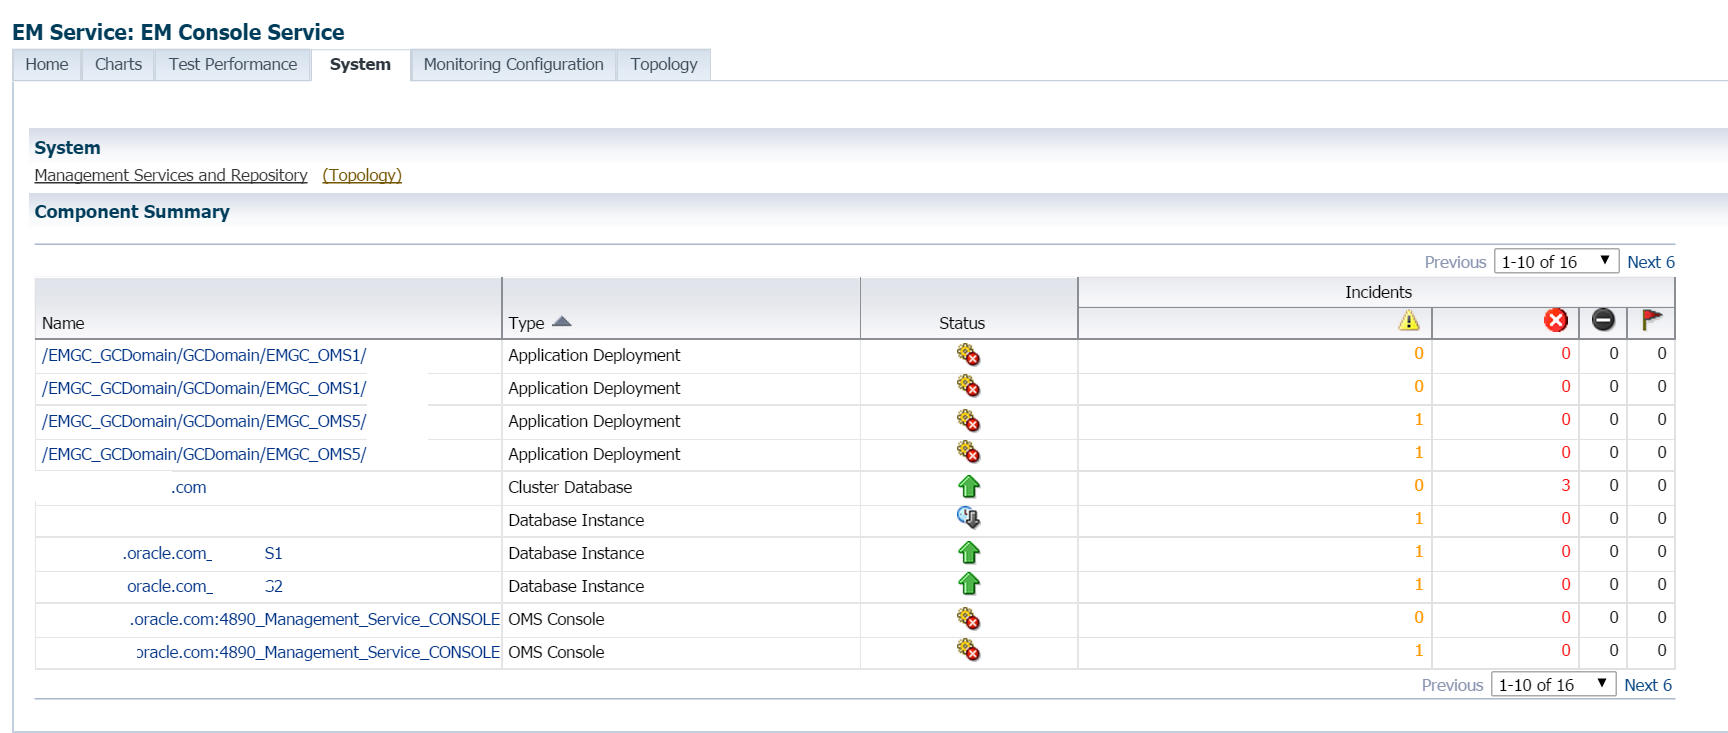
As you can see from the screen shot above, a recent test of a non-released patch has caused some grief, (this is why we test these things… :)) and there are a few applications components that were impacted and need to be reviewed and addressed. Each of the components are linked on this page, so they can be easily accessed and the incident investigated. As this is the EM Console Service, there are a number of related components, (16 total, as shown in the right hand totals) and you can change to the next page to display the rest of the components involved.
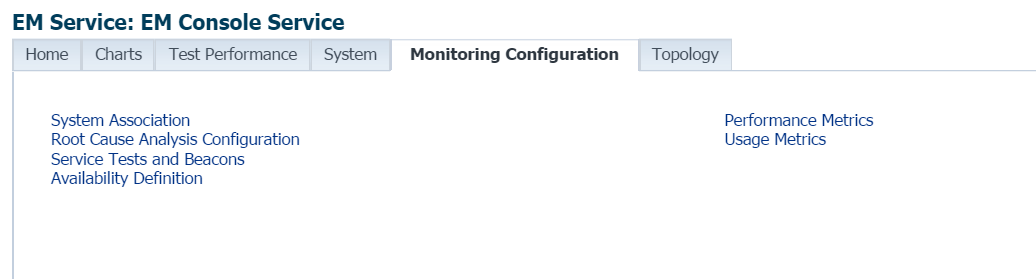
Monitoring Configuration
The Monitoring Configuration requires a section to itself, as this has some pretty impressive links in this tab. We are going to go through each one of these, so you can get a solid understanding of what is available:
System Association
First thing you need to remember, DON’T CLICK ON THE “REMOVE SYSTEM” BUTTON. Although I’ve never seen anyone attempt this from the console, I can’t imagine the damage that would be done if you chose to remove a key component from the EM Console Service unless instructed by Oracle Support, so just don’t attempt it to see what happens… 🙂
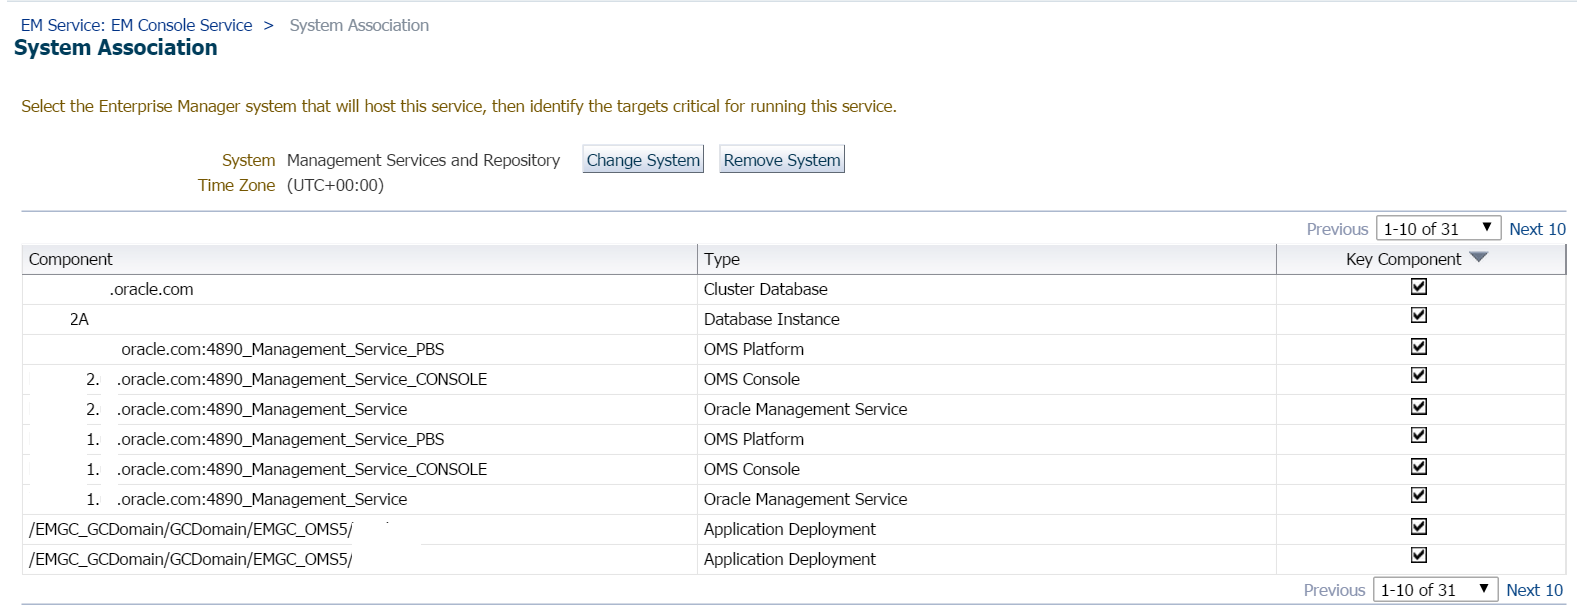
As discussed above, each component associated to the EM Console Service is displayed, along with the designation as a key component with a check mark.
Root Cause Analysis Configuration
By setting the analysis mode to manual, less stress is put on the system resources to collect root cause data at any issue, letting you control when the analysis is performed. The recommendation is to leave this set to manual mode for analysis collections and only to change it [again] with the blessing of Oracle Support.
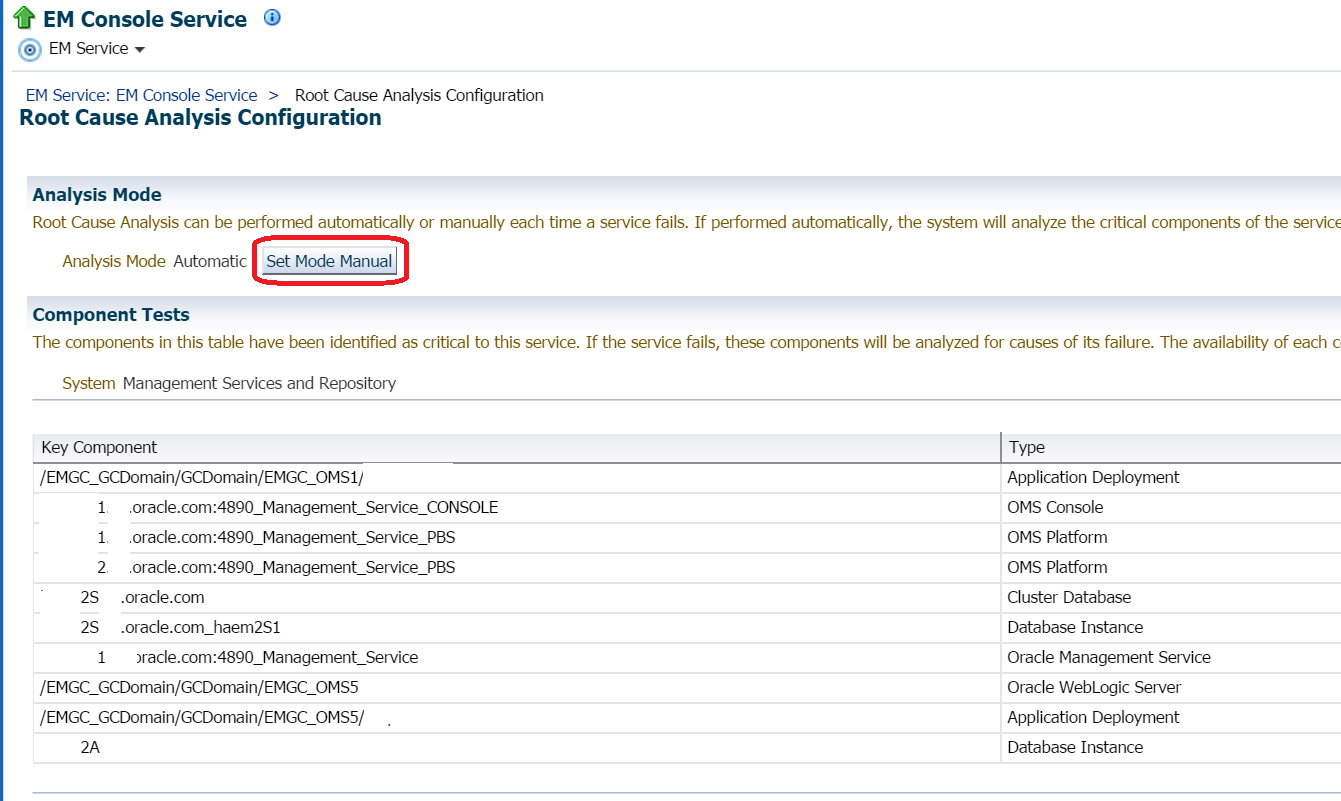 If any root cause analysis has been performed, you would view it to the right of the list of components and types, as the bottom section is reporting info only, listing each component and any test counts.
Service Tests and Beacons
This is how cloud control knows that the console service and key components are up and available. A set of tests are run on a regular interval in the form of a web transaction. This means that the test logs in, verifies a result from the URL for cloud control and verifies each key component is responsive. If all tests result in a positive result, then the status is ‘up’.
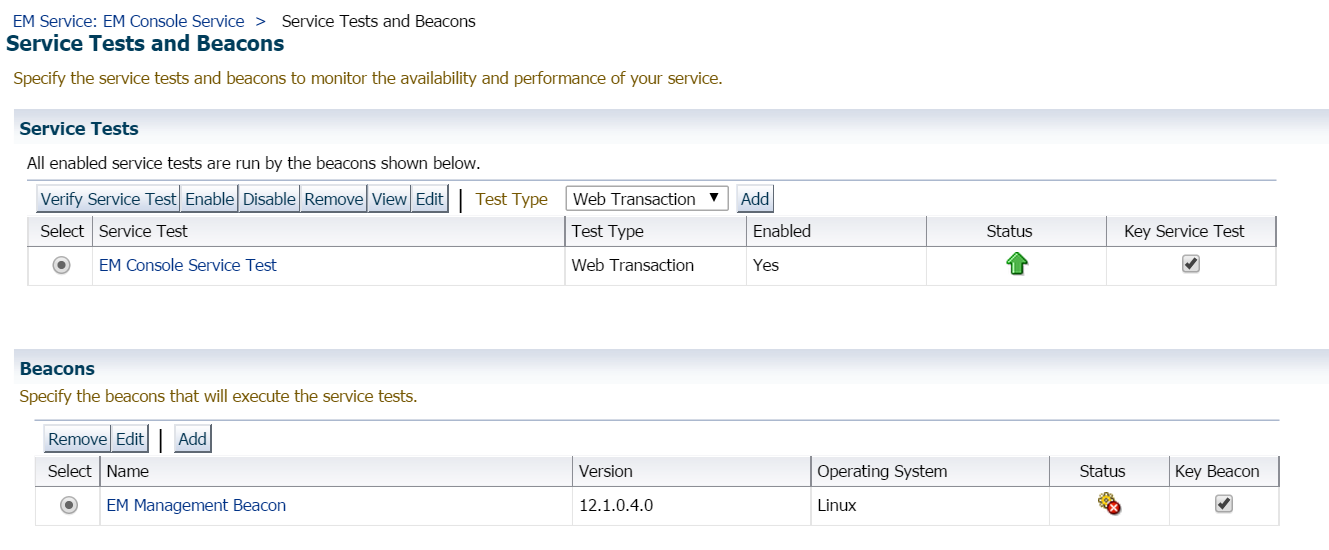
A beacon is a target used to monitor service tests, primarily to measure performance of the service. One beacon belongs to at least each service test and is used to check connectivity between the client and the OMS host or the OMS host and the OMR host, etc. Adding multiple beacons for one service adds no value, so if for some reason, you see multiple beacons assigned to a service, there’s a problem right there.
Availability Definition
This console looks very similar to the one above, but it covers test information about the EM Console Service Tests and EM Management Beacon:
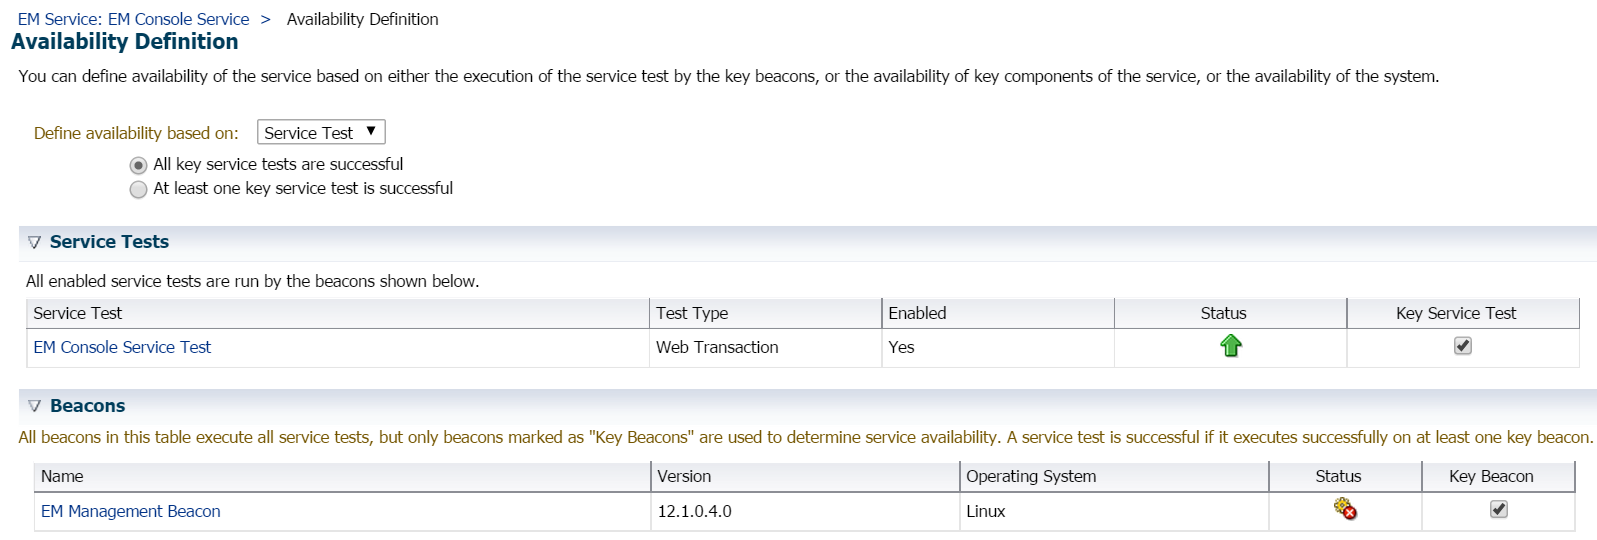
By default, both of these require ALL KEY SERVICE TESTS must be SUCCESSFUL to be marked successful and return a status of ‘up’. As you can see, the EM Management Beacon has not done so, which results in an unavailable status. The next step in trouble-shooting this would be to click on the Beacon name link and investigate what didn’t return successfully.
Performance Metrics
Performance metric data is where you set your thresholds for EM Console Service response, (and the readers say “Aha! That’s another location I can get to the valuable metric threshold setting!”)
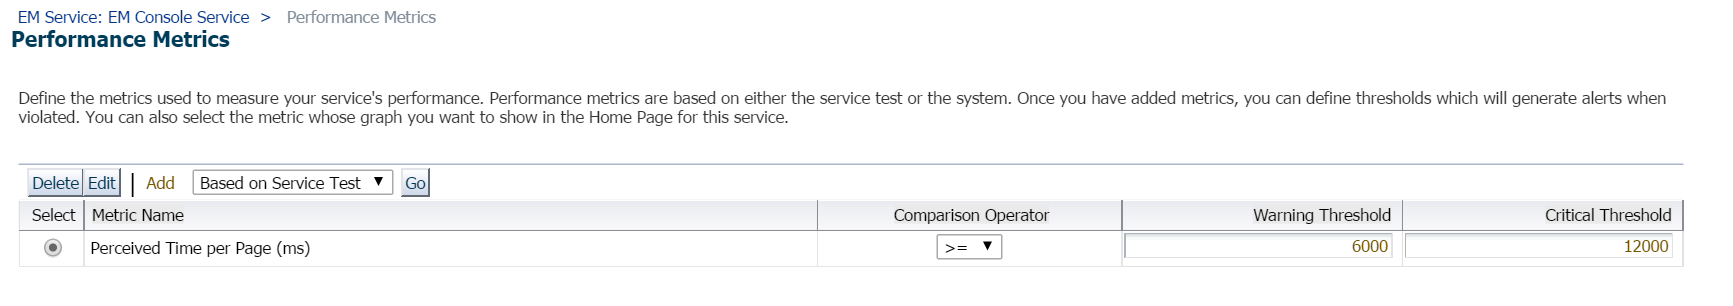
The metric value settings for the threshold are in milliseconds and if you are receiving notifications that this is beyond your response time, look at network connection, network connection between data centers, etc. and if it’s something you can’t correct, bump up the warning and critical threshold values to provide more value.
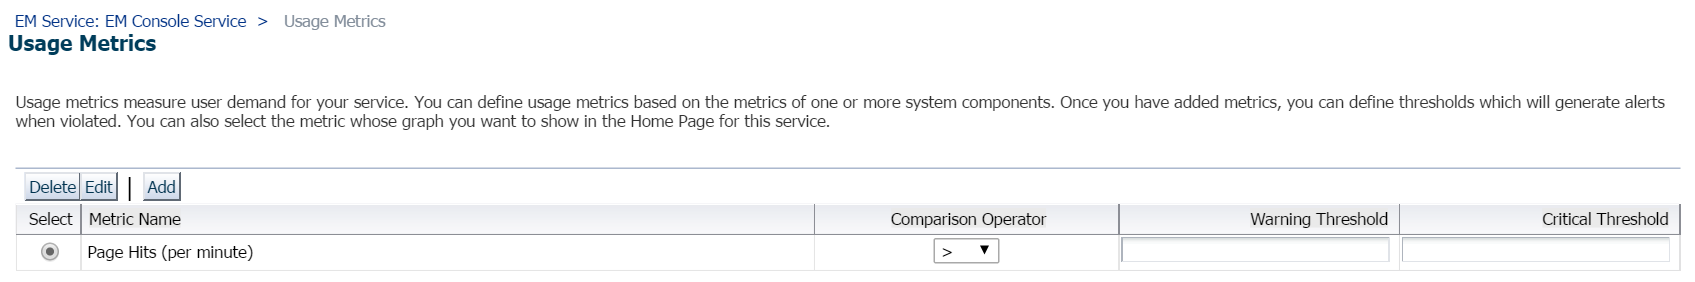
Usage Metrics
This setting by default isn’t set, but it’s one area, you can configure if you would like. If you are concerned about page performance and want to report on this metric data, set up the with a logical value to start. For a small web server, 12000 page hits per minute would be a pretty good warning value with 20000 page hits per minute critical. Use this as a beginning base, test, rinse and repeat.
Now we’ve completed a high level review of the Monitoring Configuration, we can return to the last tab, Configuration Topology.
Topology
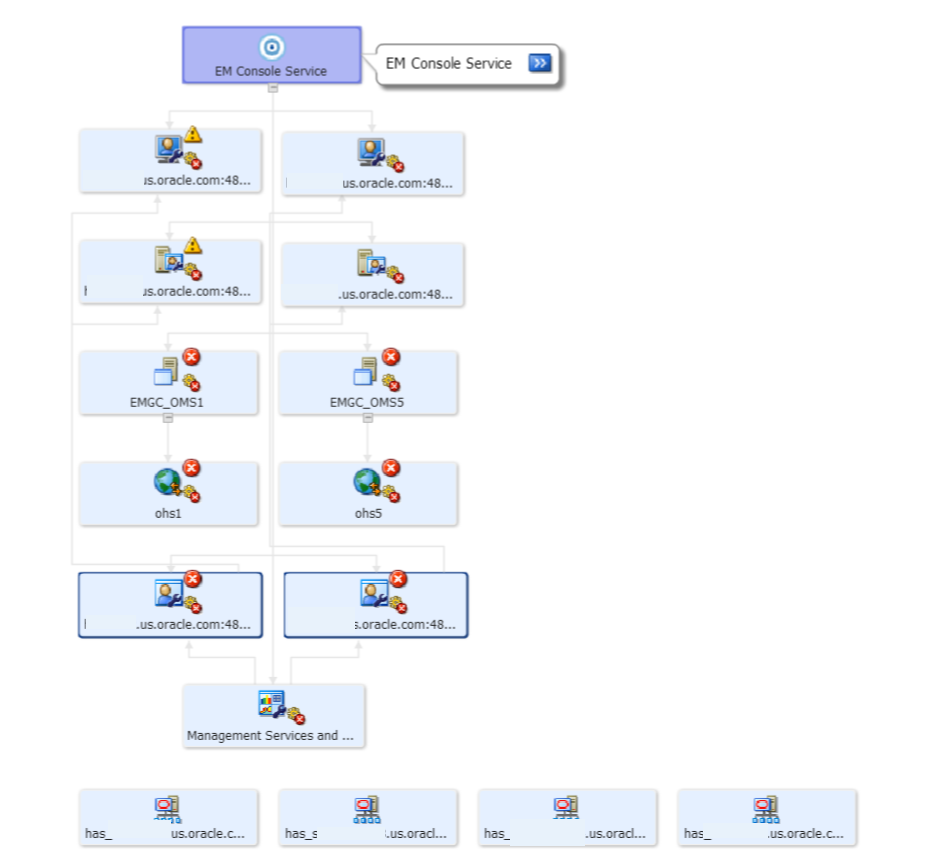
This last tab is for those of you that love topology charts. This is the ultimate in configuration topology, allowing you to interact with all data, component dependency and connections to the EM Console Service.
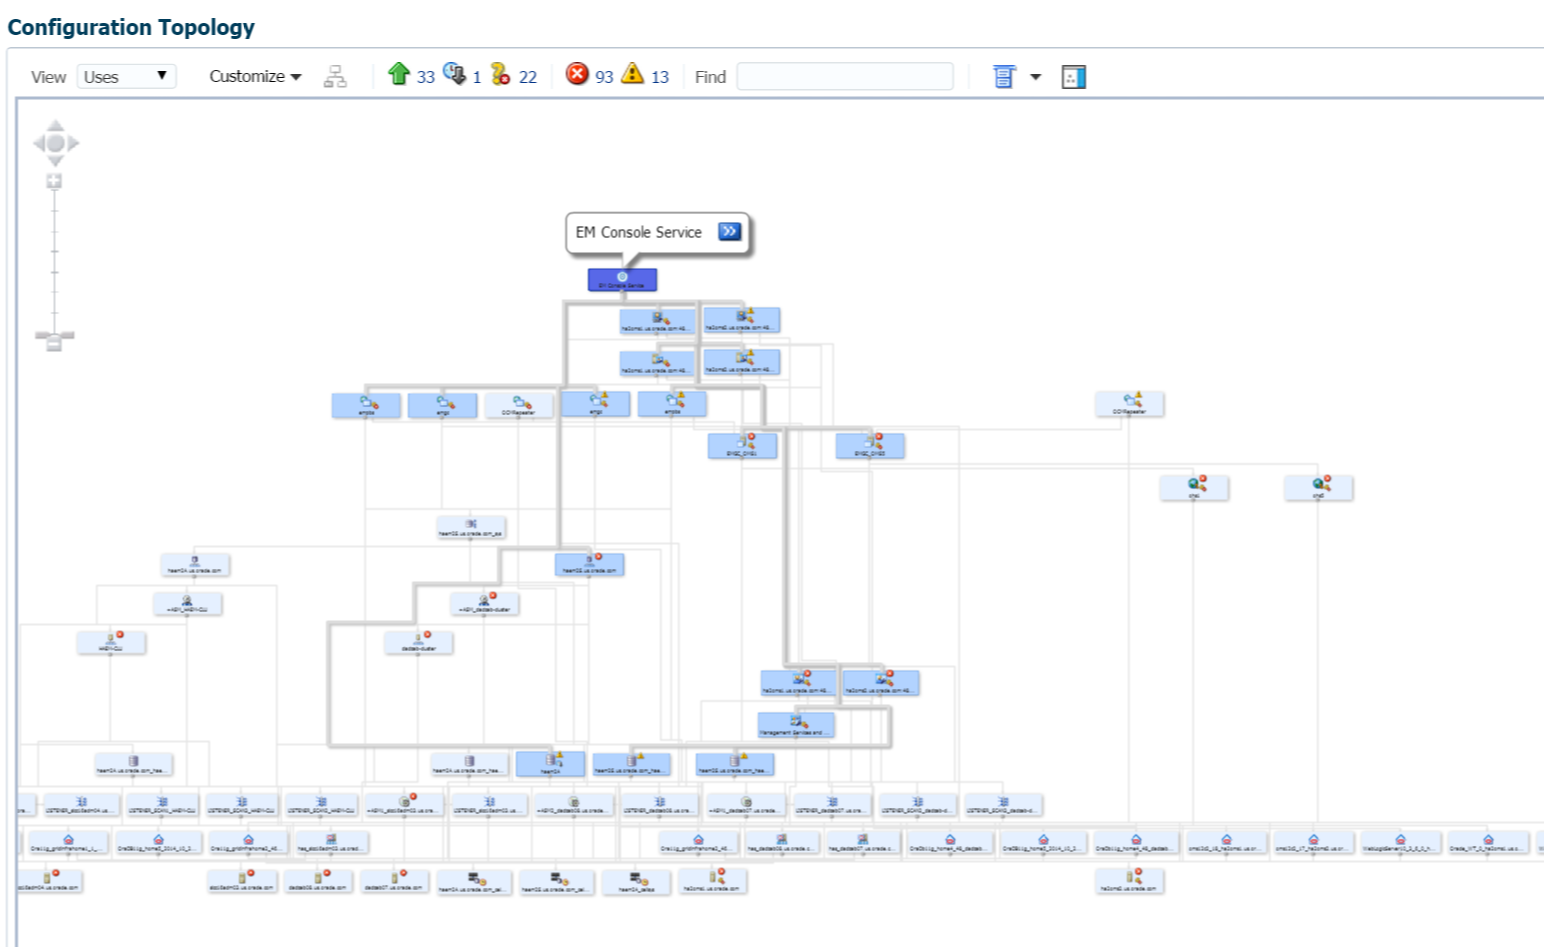
This is also where you come to realize how dependent everything is on your EM Console Service– no website, no Enterprise Manager access. By hovering my cursor over the service, you can quickly see the dependent HA servers, database instance, management agent and other essential hardware and software components that are involved with the EM12c hardware and framework. To the right is filtering options to drill down into a more manageable view:
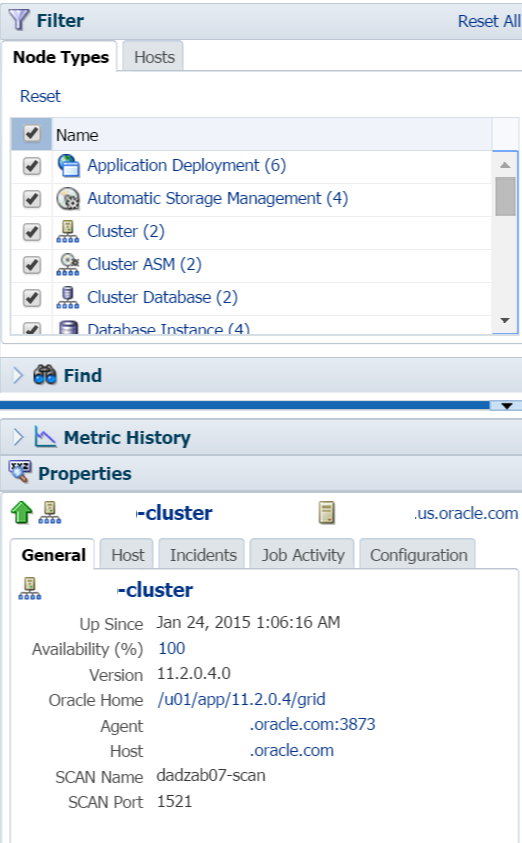
High level information about each of the targets you want to drill down on are displayed and you can use this section to create a much easier to read topology:
The topology makes even more sense if you can view all the information on each of the targets vs. me hiding host/database names… 🙂
Hopefully this review of services helps explain a little bit more about this very, very important key component to Enterprise Manager 12c. Next post on Services, I’ll go over the all important, EM Job Service.
2 Comments on “Enterprise Manager and Services, Part I”
Comments are closed.