
Creating a trace file from EM12c is quite easy and doesn’t require a DBA offering up the world to allow a developer or support person to perform this action.
Enterprise Manager also removes some of the syntax options that could get a developer or app support person that is less specialized in creating trace files, all the options and the knowledge of the syntax, etc. from getting into trouble, which creates an option for everyone to be successful.
The proposed solution that I’ll post here is where the EM12c user will be able to create trace files, but the DBA will control the OS level files, (delivering the file to the user after the trace file is created, will use a defined user to log into the database from Cloud Control and will have no target access granted previously.
Creating the Database User for Tracing
Connect to your PDB and create your user that you will be using for tracing….
create user dev_trace identified by <password>;
grant dev_trace connect, select_catalog_role, create session, alter session;
Limit the size of trace files for the database to ensure that no trace file can be forgotten and grow unconstrained:
connect system/<password@hostnm.us.oracle.com:1521/pdb1.us.oracle.com
alter system set max_dump_file_size =40960;
Once this is complete, you can create your database target credentials for your developer role that will now use this new login and limit their rights in the target as they login.
Grant the following privileges at the “Target Type Privilege” for the new user:
| Monitor Enterprise Manager | Monitor Enterprise Manager performance |
| Add any Target | Add any target in Enterprise Manager |
| View any Target | Ability to view all managed targets in Enterprise Manager |
Yes, you do have the right to switch from “View any Target” to a list of specified targets. I just figured I’d lesson the steps here, so do what fulfills your IT security model.
Add the the new role that you’ve created for your Tracing User and then complete the wizard creation for a new user in Cloud Control.
Creating a Trace File
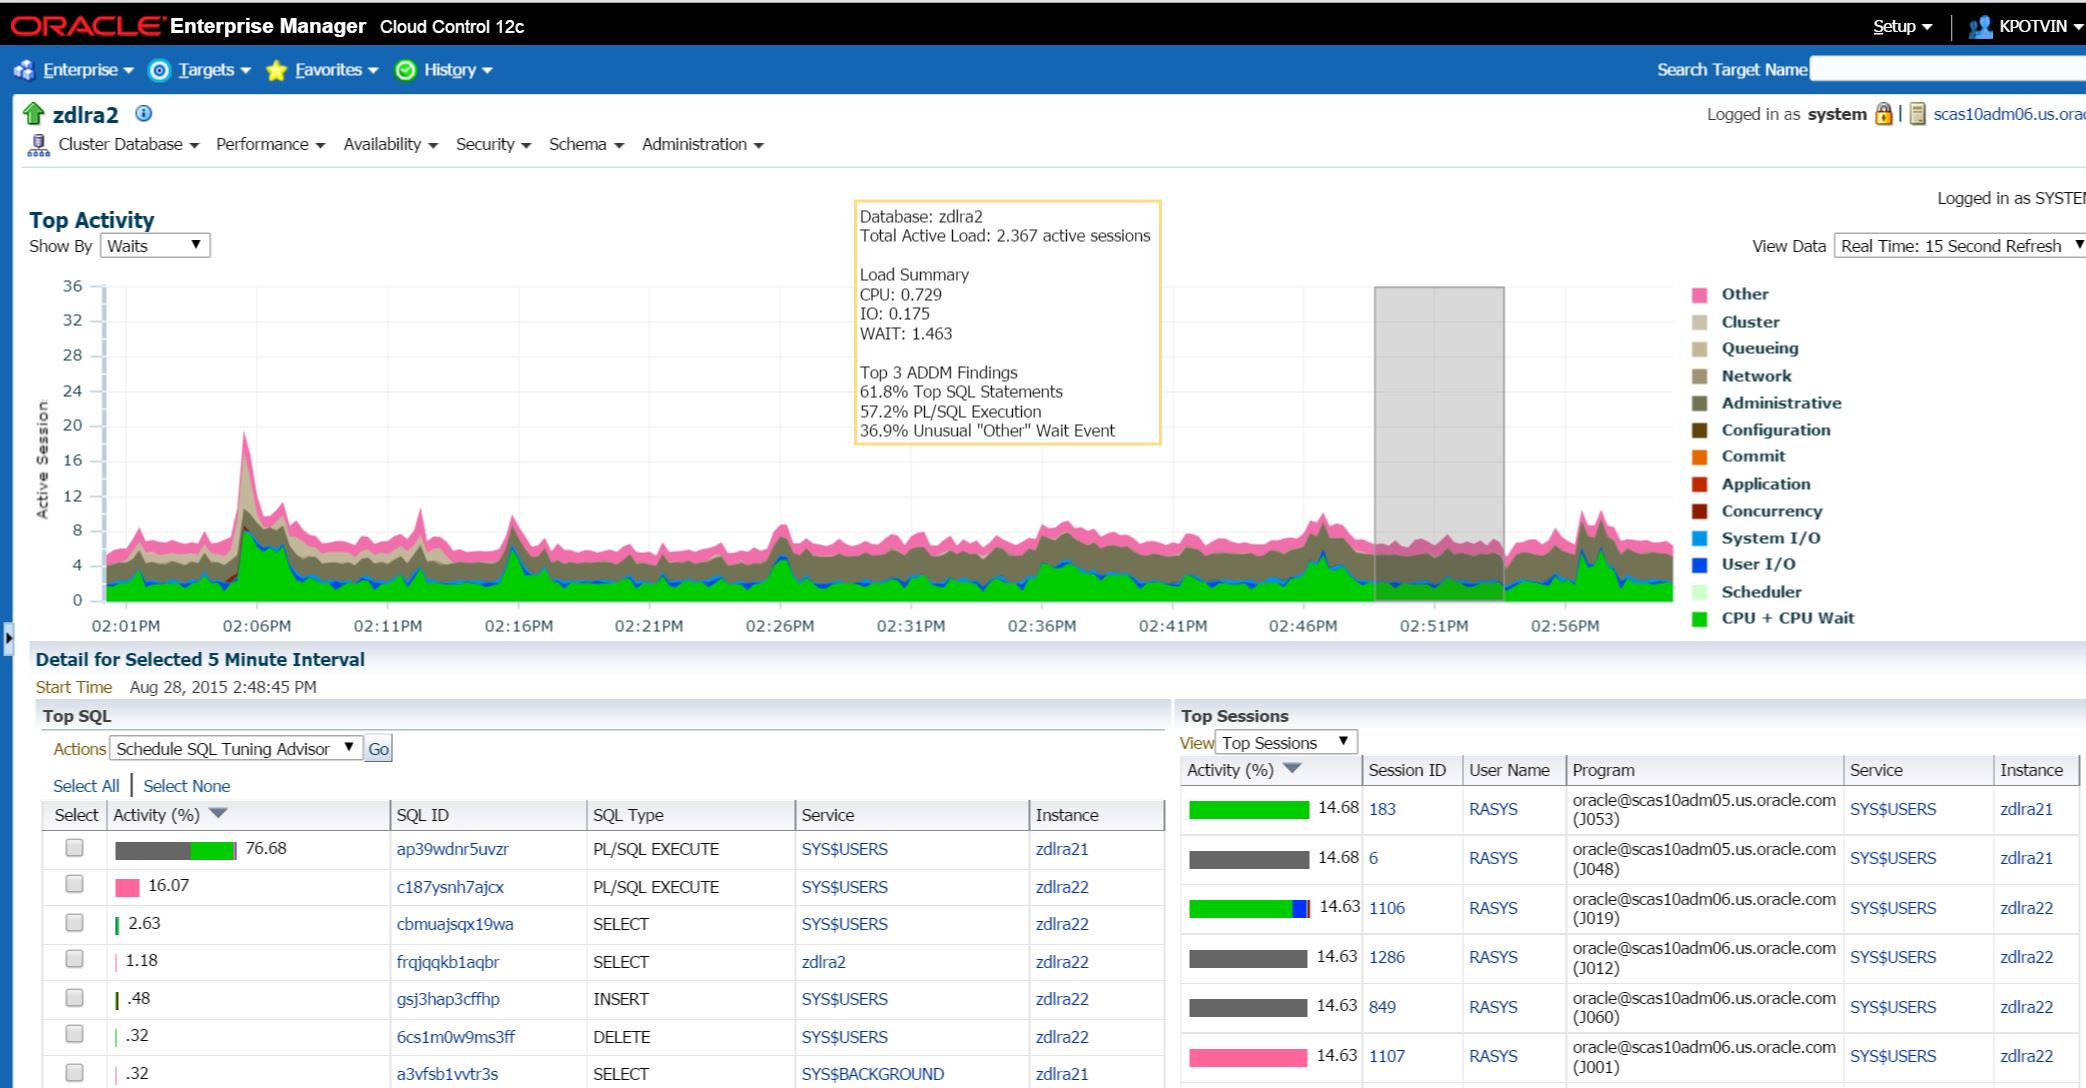
Once the user logs in, (and updates their password… :)) They should be able to log into a target and view performance data. For our example, we’ll use the following database scenario, where the developer or app support user is concerned about “Other” in Top Activity. They’ve been given a high level overview of Top Activity wait events and know that green, (CPU) is expected, dark blue, (IO) often occurs and that colors of red, (application or concurrency) brown, (configuration or network) orange, (commit) and pink, (other) should be monitored more closely.
Now tracing is a session level process that created a trace file in an OS, (Operating System) directory. For Oracle 11g and higher, this creates the file in the Automatic Diagnostic Repository, (ADR) home. The base location can be easily located by the parameter DIAGNOSTICE_DEST + /rdbms/diag/<CDB_NM>/<CDB_NM>/trace.
show parameter DIAGNOSTIC_DEST;
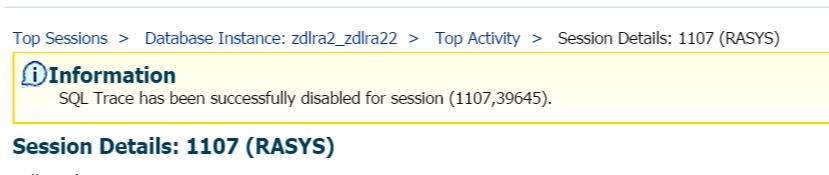
In our above Top Activity example, we can see the sessions on the right hand side and see a couple that are of concern. Since we’ve decided that we need to inspect the “Other” waits more, we will look in the Session ID column and double click on the 1107 Session ID.
This brings us to the details page for the 1107 session:
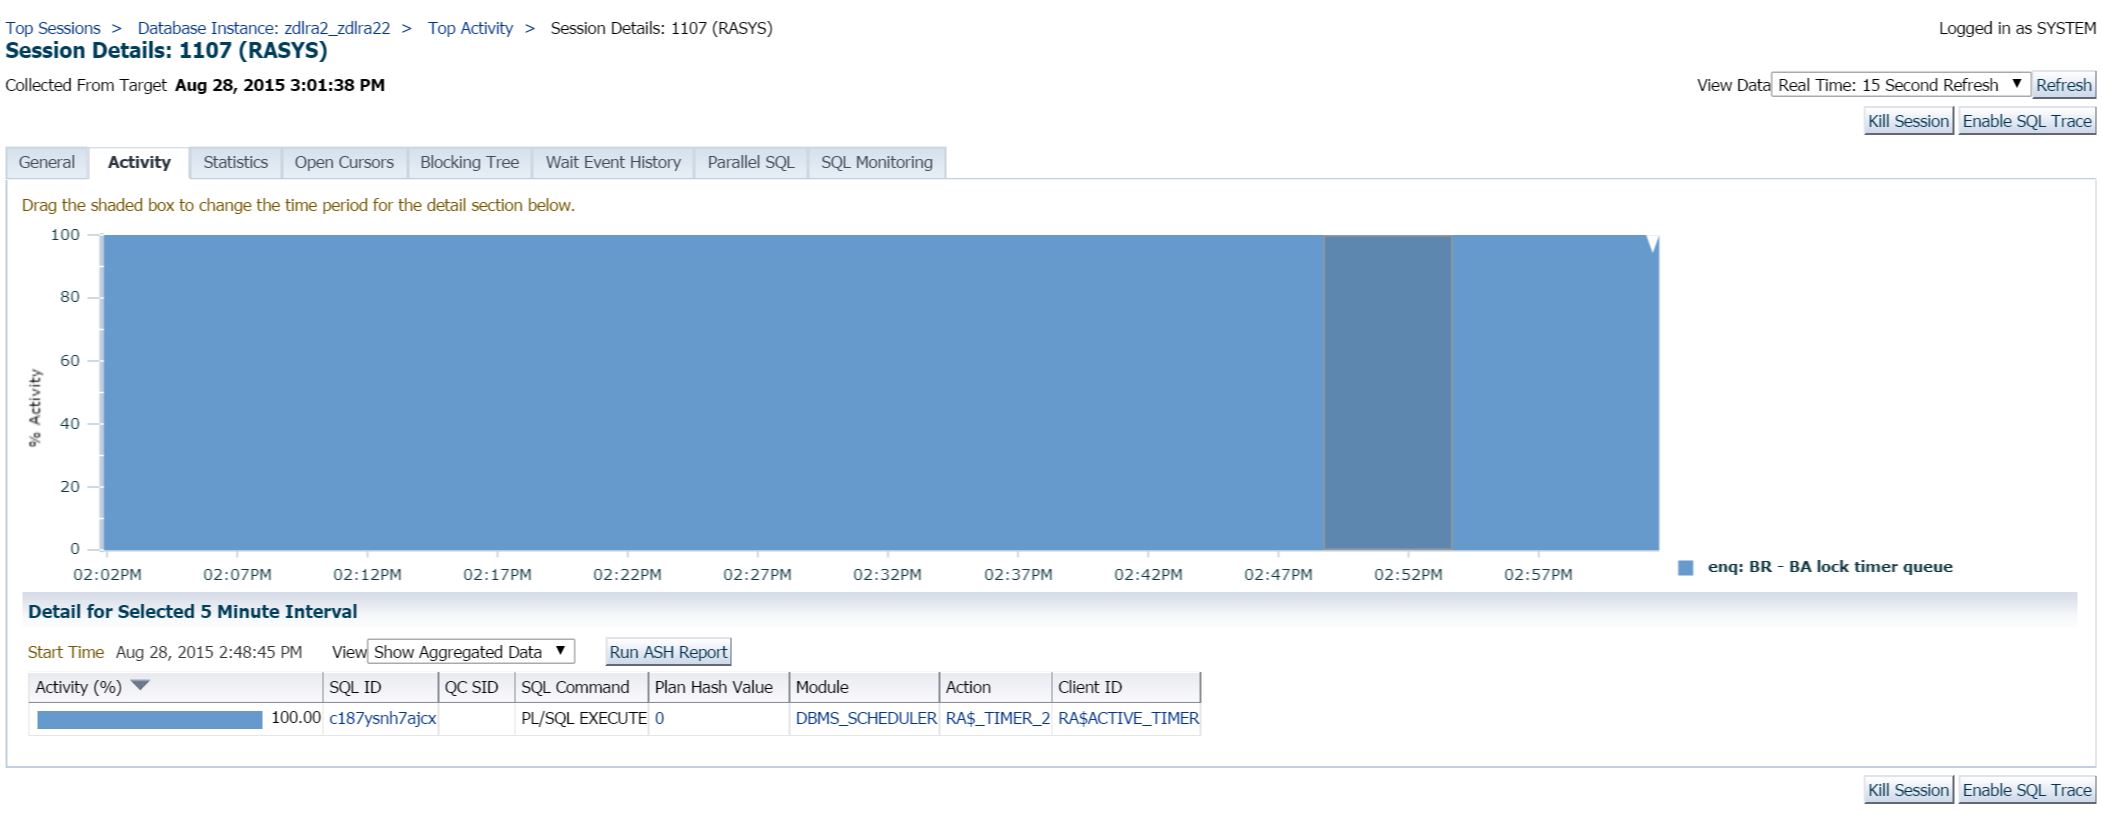
We have a number of tabs in the Details page to inspect, but let’s say we want to create a trace file to dig deeper into the ENQUEUE waits instead. To the right, at the upper and lower section, you can see the button “Enable SQL Trace”. As the user has the privileges to “Alter Session”, they can click this and it will step into the creation steps for a trace file.
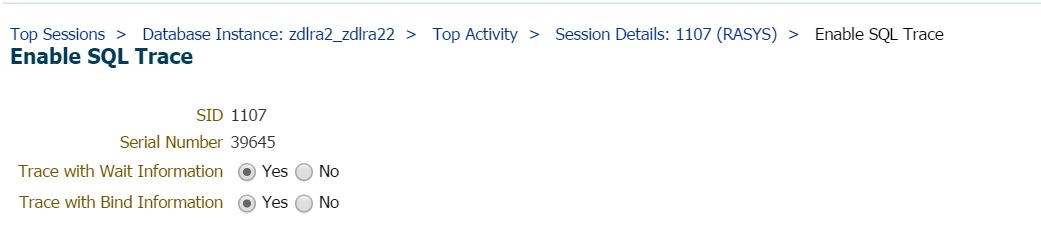
This is like performing a 10046 trace. As you can see, its very straight forward and simple vs. executing the SQL*Plus commands that would require the following for both options set to “No”:
execute dbms_support.start_trace_in_session (1107,39645, true);
To create the option with the wait information set to “Yes” we’d update our request to the following:
execute dbms_support.start_trace_in_session (1107,39645,waits=>true);
And for both to be set to “Yes”, we’d execute this command that has both:
execute dbms_support.start_trace_in_session (1107,39645,waits=>true, binds=>true);
Back to our Cloud Control option, (the easier option) once we decide to gather the wait and bind information, we can click “OK” and the trace will subsequently begin.
Once we’ve finished tracing, we should remember to turn the trace back off, (which is the reason for the DBA setting the max dump file size to have a safety net for those that forget!)
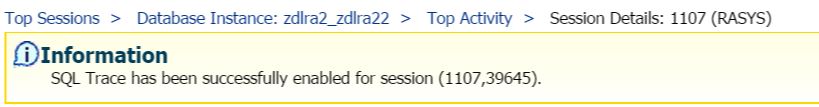
The option will then show right in the session, even if you leave and come back to the session in Cloud Control. You can click on it and disable the trace:
If you were to forget, the DBA could easily locate the session being traced in the file and they can issue the following statement from the command line to disable it:
execute dbms_support.start_trace_in_session (1107,39645, false);
Getting a READABLE Trace File Report
Now this is where your DBA comes in and you need to make friends with them. Most DBAs are not going to be comfortable granting access to OS level files and I don’t blame them. It’s best if you don’t have to worry about this access and better if they just retrieve the files for you. Before they do, you want them to convert the trace data into a readable report. This is done via the TKPROF utility.
The trace file should be easy to locate from the server in the ADR directory for trace files, (the directory is called “trace”, duh… :)) and there are two files that are created as part of your trace file- The .trm trace mapping file, which you won’t need and the .trc trace file that is the one that is required to create the report.
The DBA will run the following to create the report
tkprof <trace_file_nm>.trc <output_rpt_nm>.txt
They can SCP or FTP the output file to their workstation and this is the one that you’ll want them to send to you.
And there you have it- creating a secure user that can create trace files and then how to create the trace files once you have the access. Now you DBAs and developers make friends and bring each other donuts and maybe buy each other a drink… 🙂
2 Comments on “Creating a Trace File from EM12”
Comments are closed.