
Monitoring templates are an essential feature to a basic Enterprise Manager environment, ensuring consistent monitoring across groups and target types. There’s an incredibly vast group of experts in the EM community and to demonstrate this, Brian Williams from Blue Medora, a valuable partner of Oracle’s in the Enterprise Manager space, is going to provide a guest blog post on how simple and efficiently you can monitor even PostgreSQL databases with EM13c using custom monitoring templates!

Creating and Applying Custom Monitoring Templates in Oracle Enterprise Manager 13c
Guest Blogger: Brian Williams
Oracle Enterprise Manager 13c is a premier database monitoring platform for your enterprise. With Enterprise Manager 13c, users have access to many database-level metric alerting capabilities, but how do we standardize these threshold values across your database environment? The answer is simple: by creating and deploying Oracle Enterprise Manager’s monitoring templates.
Monitoring templates allow you to standardize monitoring settings across your enterprise by specifying the monitoring settings and metric thresholds once you apply them to your monitored targets. You can save, edit, and apply these templates across multiple targets or groups. A monitoring template is specified for a particular target type and can only be applied to targets of the same type. A monitoring template will have configurable values for metrics, thresholds, metric collection schedules, and corrective actions.
Today we are going to walk through the basic steps of creating a custom monitoring template and apply that template to select database targets. In this example, I will be creating templates for my newly added PostgreSQL database targets monitored with the Oracle Enterprise Manager Plugin for PostgreSQL from Blue Medora.
To get started, login to your Oracle Enterprise Manager 13c Cloud Control Console. Navigate to the Enterprise menu, select Monitoring and then Monitoring Templates. From this view, we can see a list of all monitoring templates on the system. To begin creating a new monitoring template, select Create from this view. If you are not logged in as a super admin account, you may need to grant the resource privilege Create Monitoring Template.
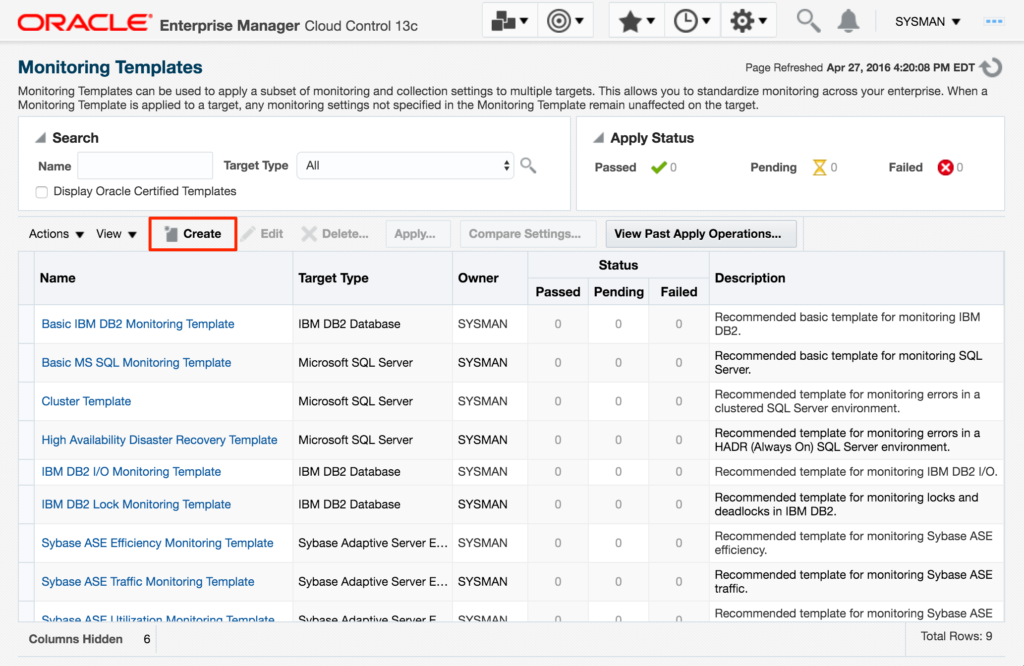
Figure 1 – Monitoring Templates Management Page
From the Create Monitoring Template page, select the Target Type radial button. In the Target Type Category drop down, select Databases. In the Target Type drop down, select PostgreSQL Database, or the target type of your choice. Click Continue.
The next screen presented will be the Create Monitoring Template page. Name your new template, give a description, and then click the Metric Thresholds tab. From the Metric Thresholds tab, we can begin defining our metric thresholds for our template.
You will be presented with many configurable metric thresholds. Find your desired metrics and from the far right column named Edit, click the Pencil Icon to edit the collection details and set threshold values. After setting the threshold values, click Continue to return to the Metric Thresholds view and continue to configure additional metric thresholds as needed. After all metrics have been configured, click OK to finish the creation of the monitoring template.
The final step to make full use of your newly created template is to apply the template to your selected target databases. From the Monitoring Templates screen, highlight your template, select Actions, and then Apply. Select the apply option to completely replace all metric settings in the target to use only metrics configured in your template. Click the Add button and select all database targets desired for the application. After the targets are added to the list, click Select All to mark targets for final application. Click OK to process the application. The deployment can be tracked by watching the Pending, Passed, or Failed number for the Apply Status box on the Monitoring Templates page.
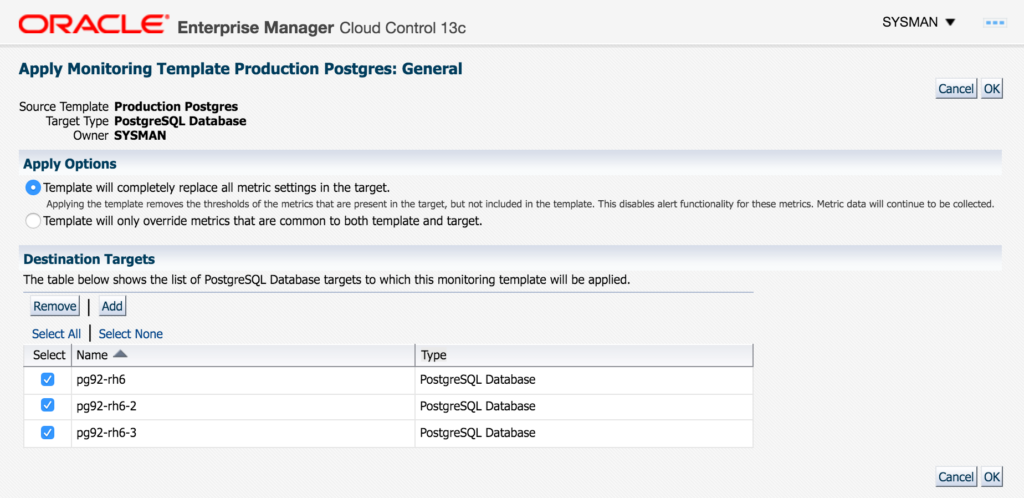
Figure 2 – Apply Monitoring Template to Destination Targets
Now that I have the newly created template applied, I can navigate back to my database target home page and view top-level critical alerts based on my configurations.
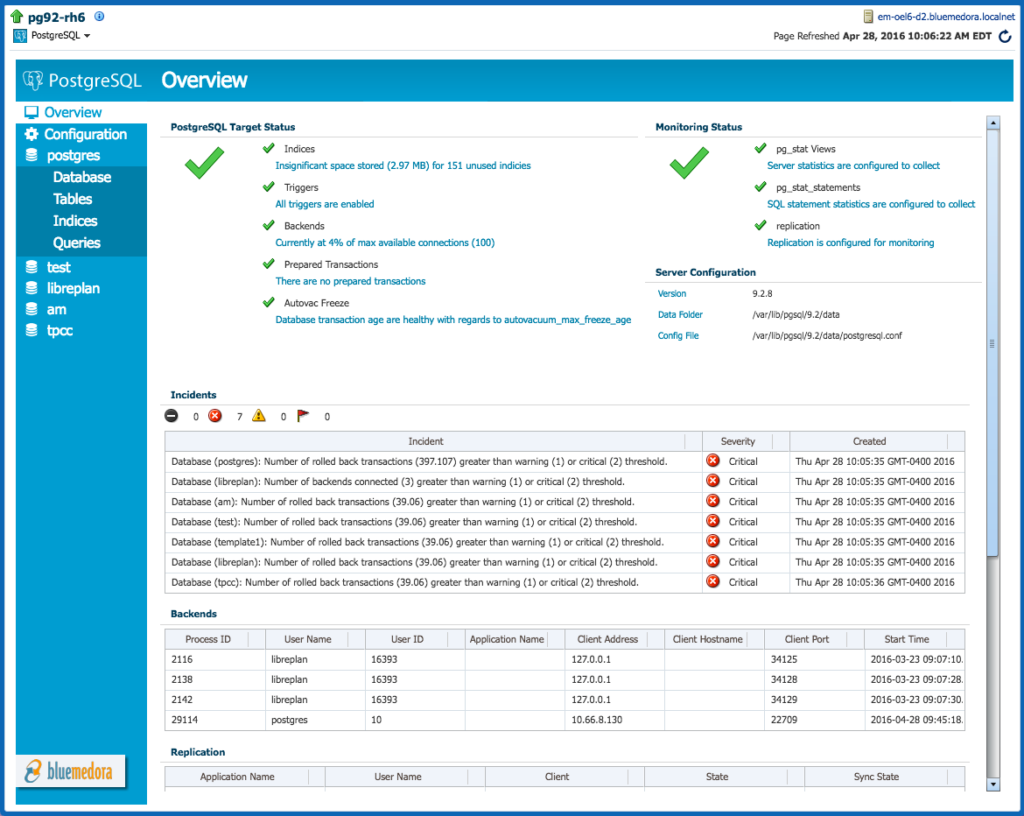
Figure 3 – Target Home Page and PostgreSQL Overview
Although your database targets will eventually alert with issues, there is a solution available to give you at-a-glance visibility into PostgreSQL high availability via replication monitoring; check out the Oracle Enterprise Manager Plug-in for PostgreSQL by visiting Blue Medora’s website for product and risk-free trial information. For more walkthroughs on creating and applying monitoring templates, refer to the Enterprise Manager Cloud Control Administrator’s Guide, Chapter 7 Using Monitoring Templates.
Brian Williams is a Solutions Architect at Blue Medora specializing in Oracle Enterprise Manager and VMware vRealize Operations Manager. He has been with Blue Medora for over three years, also holding positions in software QA and IT support. Blue Medora creates platform extensions designed to provide further visibility into cloud system management and application performance management solutions.
One comment on “Blue Medora’s Brian Williams Blogs About Custom Monitoring Templates”
Comments are closed.