So Tracy Boggiano told me about the great First Responder kit that Brent Ozar had available to use with sp_Blitz using Power BI desktop for a UI, but that it was really slow to non-responsive as data grew. As this was focused on performance data and also included my new love of Power BI, I asked to take a look at it. Tracy was kind enough to send me a copy of her database and the support files for the responder kit and I finally had time to look into it this week. We won’t discuss how I managed to find time for this with so much expected after the holidays are now over.

The gist of this kit is that it is a database repository as part of the sp_BlitzFirst to collect monitoring alerting and performance metric data. Once you’ve set this up, then you can use a Power BI desktop dashboard as an interface for all that data.
Now this is an awesome way to introduce more DBAs to Power BI and it’s a great way to get more out of your metrics data. The challenge is, it’s a lot of data to be performing complete refreshes on and the natural life of a database like this is growth. The refresh on the static database I was sent by Tracy, once I connected my PBIX to the local db sources, took upwards of an hour to refresh. Keep in mind, I have 16G of memory, 32G of swap and have upped my data load options in Power BI quite high.
There were a few things I did to monitor the demands on the system while it refreshed the data in Power BI-
- Ran DAX Studio to identify if there were any DAX that could be made more efficient.
- Reviewed indexes on the database with queries, as well as the database design.
- Inspected the logs from the refreshes of the data by pulling them into Power BI.
Results
The range scans on PK__BlitzFir__3214EC2793CCC163 was of the most concern in the database. This index is on the BlitzFirst_PerfmonStats table and for a single refresh, performed 142 scans.
There were a few DAX statements that would benefit from some streamlining that were the cause of the PerfmonStats poor scans, so it is an area to look into.
From the log review though, what I discovered is that any and all of these changes would only help minimally. The real change would have to be in the entire data model design. This could be an introduction to a narrow, tabular data model in analysis services or creating reporting tables within the SQL Server sp_BlitzFirst db that is designed specifically for optimal import to Power BI.
There was a quick solution to help though- as Power BI Desktop doesn’t have incremental refresh in the Desktop version, we CAN update the PBIX file to use DIRECT QUERY and offload the pressure to the SQL Server database. Upon doing so, I experienced refresh times that went down from an hour to a matter of seconds by doing so.
So if you’re looking for a setting to do this, there isn’t one, but there is a tricky way to do this without having to rebuild it all. Follow the steps below if you’d like to try it out.
Create Your Zip Files from the PBIX Files
- Make a copy of the PBIX file as a backup.
- Open a new Power BI Desktop file, connect it to the SQL Server Database that you’re currently importing from, but choose DIRECT Query instead of IMPORT.
- Save the file under a new name.
- Rename both your original file and the new file with .zip, (I know, it sounds strange, but trust me….)
Edit the “Zip” Files
- Now open up file explorer with each file, but only “EXTRACT ALL” on the new file you created and renamed.
- In the original, imported version file, when you open up the “zip” file, you will see all the components of the Power BI file.
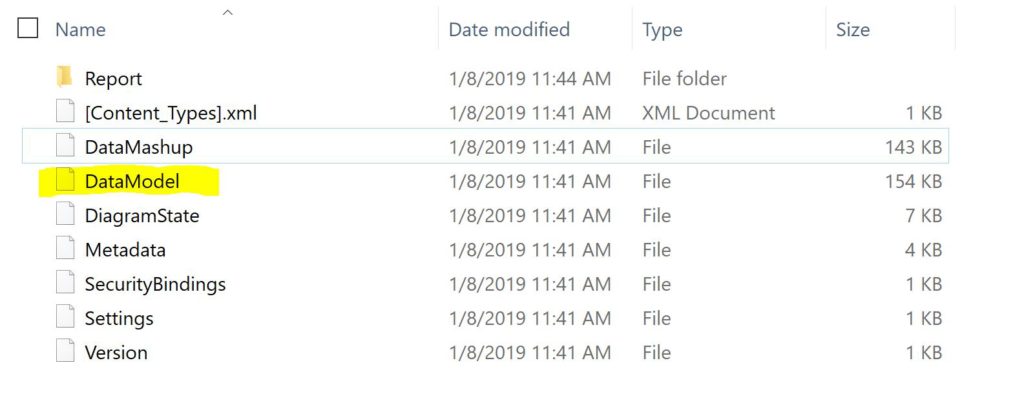
- DELETE the DATA MODEL folder from the original version’s zip file.
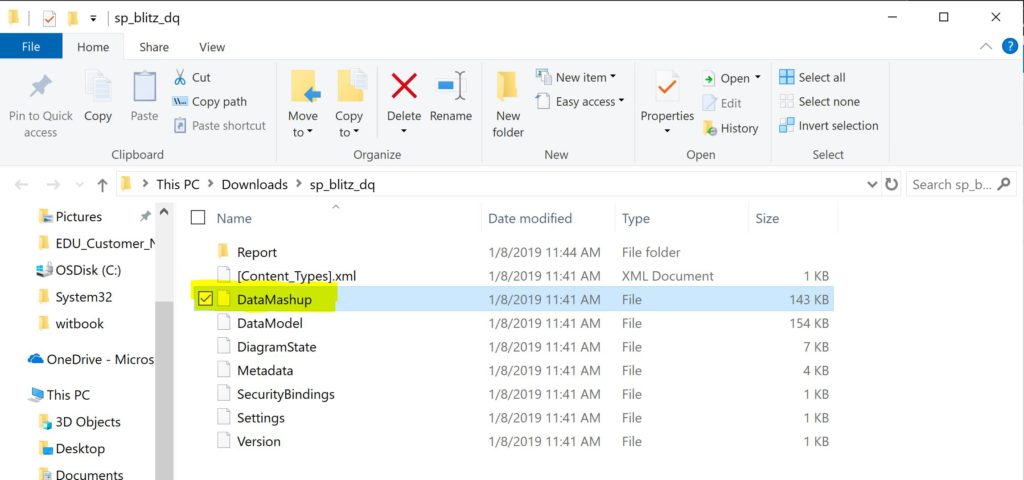
- Then COPY the DATA MASHUP folder from the NEW zip folder extract, (this is why we needed to actually extract this one and NOT the original. We’re adding this to the original zip file!) to the ORIGINAL zip folder.
- Close out the extract and go back to the original zip file in the file explorer. RENAME it back to the proper .bpix extention, (I had named my files sp_blitz_imp.zip and sp_blitz_dq.zip to distunguish which was which, so needed to remove those unique identifiers, too.)
- Now I have my original file back, renamed to sp_blitz.pbix. You can delete the second file if you want, it’s no longer necessary.


You can now open the original, edited file. You may receive a couple errors and the screen may say, “fix it” on a few visuals. Don’t worry and just click on it to refresh. If you click on refresh, you will now see the distinct notification that you’re now using direct query instead of import with this PBI Dashboard.
Recreate PBI Measures
The last step is to recreate the Measures that aren’t part of the database, but part of the original Power BI data model and aren’t present now. These will need to be added to the BlitzFirst_WaitStats_Delta and the BlitzFirst_FileStats_Delta table. To add a new measure, right click on the table and left click on New Measure or choose new measure while the table is highlighted from the ribbon at top.

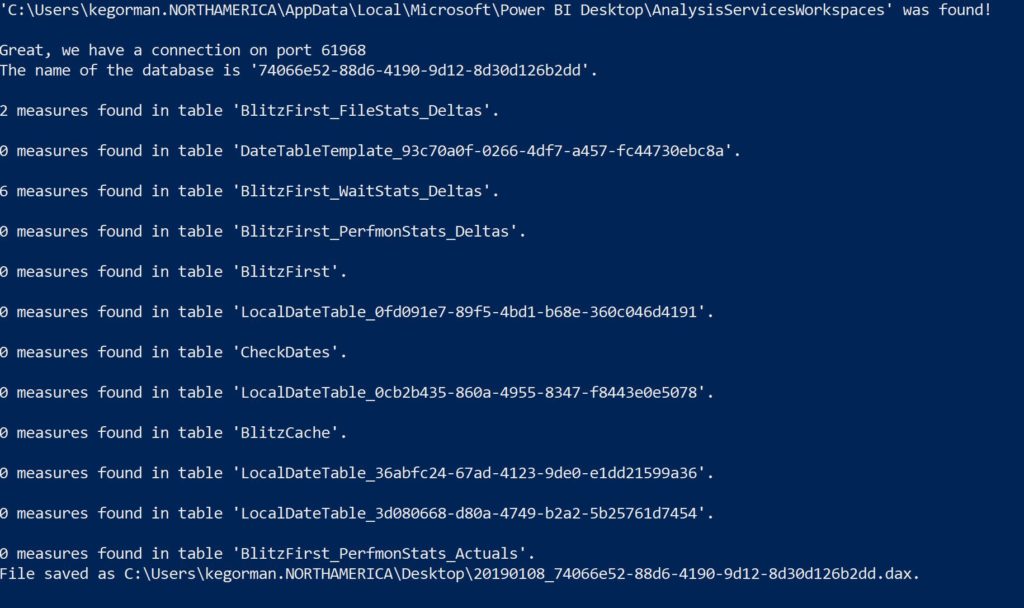
There are eight measures total that need to be added to the data model, so you’ll need to create a NEW MEASURE for each one, six in the BlitzFirst_WaitStats_delta table and two in the BlitzFirst_filestats_delta table. To ensure I captured all of them, I used a powershell script that for me to use, required a bit of editing on how it captured the port, (I used netstat and parsed the port from there vs. the msdv text file, which was part of the original script.)

Once this was completed, then I used the following output to recreate each of those measures. Each of the RANK measures rely on the WGrowth measure, so that’s why this one is created first.
 WGrowth = VAR _MAX =
 CALCULATE(MAX(BlitzFirst_WaitStats_Deltas[Wait Time, Minutes per Minute]),VALUES(BlitzFirst_WaitStats_Deltas[wait_type]))
 VAR _AVG = CALCULATE(AVERAGE(BlitzFirst_WaitStats_Deltas[Wait Time, Minutes per Minute]),
 ALL(BlitzFirst_WaitStats_Deltas[wait_type]),
 ALL(BlitzFirst_WaitStats_Deltas[CheckDate]))
 RETURN
 IF (RANKX( ALL(BlitzFirst_WaitStats_Deltas[wait_type]),
    DIVIDE(_MAX,_AVG) ,,DESC,Dense) <= 5,
    DIVIDE(_MAX,_AVG) , BLANK())
Click on the Check mark to the left to complete the process of creating the measure. Right click on New Measure, paste in the text for the measure below for each one, (Batch Rank 1-5 and then the two for the file stats details) and click the check mark after pasting in each one to ensure it’s created.
 Batch Rank 1 = VAR RankingDimension = VALUES(BlitzFirst_WaitStats_Deltas[wait_type])
 RETURN
 CALCULATE( [WGrowth],
     FILTER(RankingDimension,
         RANKX( ALL(BlitzFirst_WaitStats_Deltas[wait_type]), [WGrowth],,DESC,Dense) = 1 ))


 Batch Rank 2 = VAR RankingDimension = VALUES(BlitzFirst_WaitStats_Deltas[wait_type])
 RETURN
 CALCULATE( [WGrowth],
     FILTER(RankingDimension,
         RANKX( ALL(BlitzFirst_WaitStats_Deltas[wait_type]), [WGrowth],,DESC,Dense) = 2 ))


 Batch Rank 3 = VAR RankingDimension = VALUES(BlitzFirst_WaitStats_Deltas[wait_type])
 RETURN
 CALCULATE( [WGrowth],
     FILTER(RankingDimension,
         RANKX( ALL(BlitzFirst_WaitStats_Deltas[wait_type]), [WGrowth],,DESC,Dense) = 3 ))


 Batch Rank 4 = VAR RankingDimension = VALUES(BlitzFirst_WaitStats_Deltas[wait_type])
 RETURN
 CALCULATE( [WGrowth],
     FILTER(RankingDimension,
         RANKX( ALL(BlitzFirst_WaitStats_Deltas[wait_type]), [WGrowth],,DESC,Dense) = 4 ))


 Batch Rank 5 = VAR RankingDimension = VALUES(BlitzFirst_WaitStats_Deltas[wait_type])
 RETURN
 CALCULATE( [WGrowth],
     FILTER(RankingDimension,
         RANKX( ALL(BlitzFirst_WaitStats_Deltas[wait_type]), [WGrowth],,DESC,Dense) = 5 ))


 List of FileLogicalName values = VAR __DISTINCT_VALUES_COUNT = DISTINCTCOUNT('BlitzFirst_FileStats_Deltas'[FileLogicalName])
 VAR __MAX_VALUES_TO_SHOW = 3
 RETURN
   IF(
     __DISTINCT_VALUES_COUNT > __MAX_VALUES_TO_SHOW,
     CONCATENATE(
       CONCATENATEX(
         TOPN(
           __MAX_VALUES_TO_SHOW,
           VALUES('BlitzFirst_FileStats_Deltas'[FileLogicalName]),
           'BlitzFirst_FileStats_Deltas'[FileLogicalName],
           ASC
         ),
         'BlitzFirst_FileStats_Deltas'[FileLogicalName],
         ", ",
         'BlitzFirst_FileStats_Deltas'[FileLogicalName],
         ASC
       ),
       ", etc."
     ),
     CONCATENATEX(
       VALUES('BlitzFirst_FileStats_Deltas'[FileLogicalName]),
       'BlitzFirst_FileStats_Deltas'[FileLogicalName],
       ", ",
       'BlitzFirst_FileStats_Deltas'[FileLogicalName],
       ASC
     )
   )


 List of PhysicalName values = VAR __DISTINCT_VALUES_COUNT = DISTINCTCOUNT('BlitzFirst_FileStats_Deltas'[PhysicalName])
 VAR __MAX_VALUES_TO_SHOW = 3
 RETURN
   IF(
     __DISTINCT_VALUES_COUNT > __MAX_VALUES_TO_SHOW,
     CONCATENATE(
       CONCATENATEX(
         TOPN(
           __MAX_VALUES_TO_SHOW,
           VALUES('BlitzFirst_FileStats_Deltas'[PhysicalName]),
           'BlitzFirst_FileStats_Deltas'[PhysicalName],
           ASC
         ),
         'BlitzFirst_FileStats_Deltas'[PhysicalName],
         ", ",
         'BlitzFirst_FileStats_Deltas'[PhysicalName],
         ASC
       ),
       ", etc."
     ),
     CONCATENATEX(
       VALUES('BlitzFirst_FileStats_Deltas'[PhysicalName]),
       'BlitzFirst_FileStats_Deltas'[PhysicalName],
       ", ",
       'BlitzFirst_FileStats_Deltas'[PhysicalName],
       ASC
     )
   )
Once these are created, go back to the Power BI Dashboard and click on the Wait Stats tab. Click on “Fix This” for each of the reports that aren’t currently functioning and they should then update and run without issue now that they have the measure that’s required for each.
From this point on you have a Power BI Desktop Dashboard using Direct Query instead of importing the data. The measures are going to impact performance and can be mitigated as I go forward, but this is a good start to address performance issues due to no incremental refreshes in the Power BI Desktop for this kit.


One comment on “Speeding up Power BI Interface for sp_Blitz/First Responder Kit”
Comments are closed.