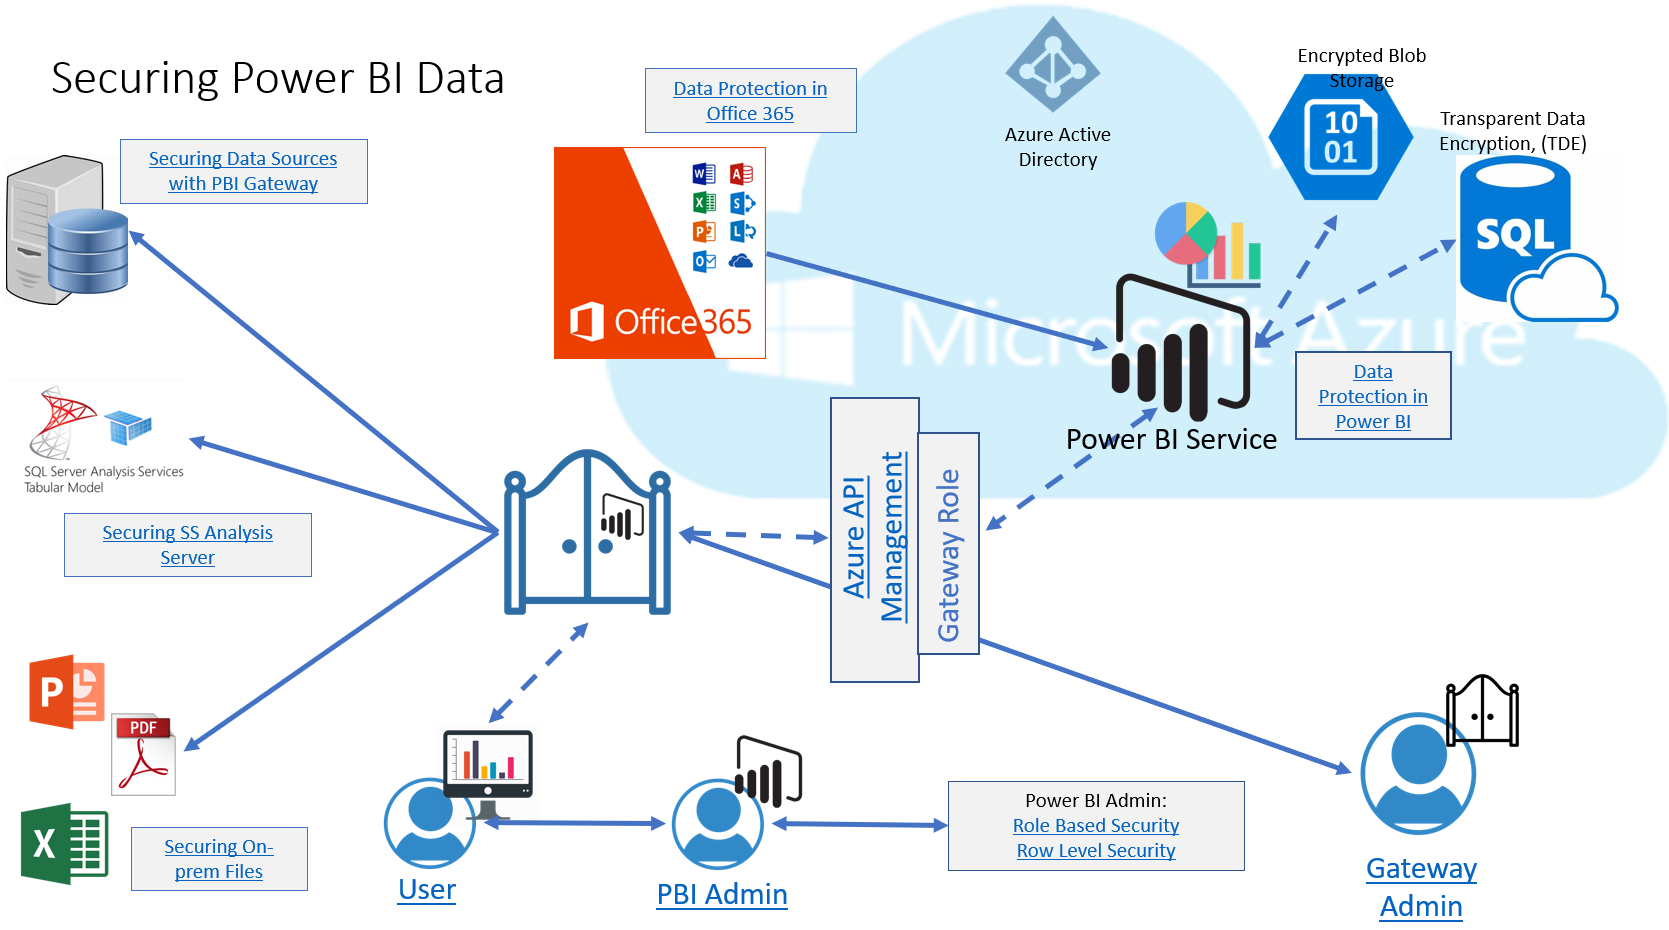
I haven’t been very good at sharing my analytics work as often I feel others are more skilled in this area than I am, just starting out, but today I’d like to start to fix that by sharing an interactive diagram. I know, some of you may be saying, “infographic”, but as it’s has links vs. a paginated design, I’ll call it as I see it.
Not the Kitchen Sink
This diagram I built for a customer who was interested in how data was secured at different stages of the Power BI environment and was built with their specific Power BI eco-system in mind. Due to that. it’s composed of Power BI Pro, the Power BI shared service, on-prem data sources/files, SQL Server Analysis Server, along with Office 365. This interactive diagram contains links at each stage to Microsoft documentation to gain more in-depth understanding of the feature or data security features.
It does include information about Power BI roles and responsibilities, but doesn’t go into the Azure Active Directly layer, (it’s a busy diagram as it is!) If the arrows are a bit confusing, also know this customer was using only direct query for their reports/dashboards, as they have very strict governance over data sharing in Power BI.
Downloadable
As the file does have a number of links, the file can be downloaded. This file has all the links and is a simple Power Point file:
And There’s More
As there are still an abudant number of areas that are of a definitive interest to the security professional, I’ve added a few additional links I think are important to any organization that is facing data governance with Power BI analytics:
- Power BI White Papers
- Using Lineage Feature in Power BI
- Auditing in Power BI
- Minute differences in Direct Query and Live Connection
- Microsoft Compliance Center
I hope this is helpful and if you have any additional areas that you’d like to see covered, click on the comment section for this post and let me know!


