IOPS: 26215 per second
MBPs: 13008 per second
Interesting ratio of IO requests vs. throughput:
| Source |
IO Requests Reads |
MBPs Reads |
Ratio |
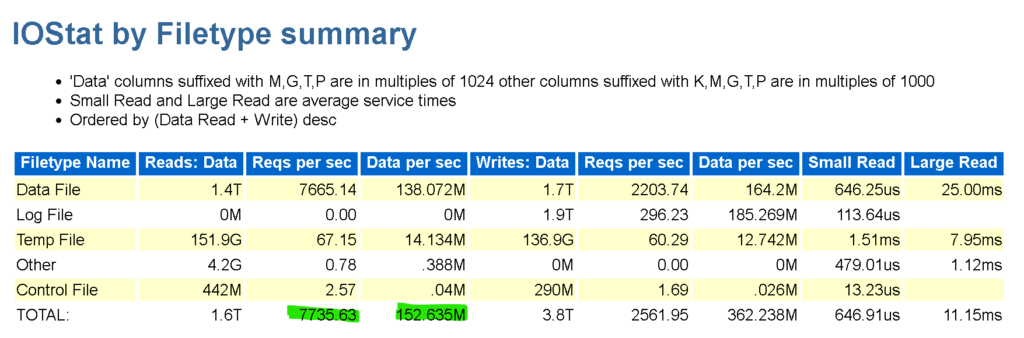
| Example #1 |
7736 |
153 |
51:1 |
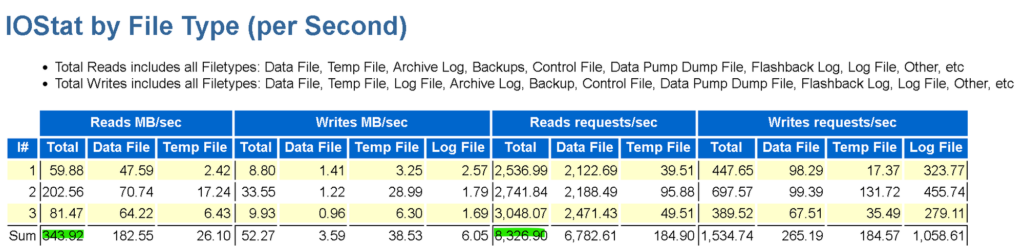
| Example #2 |
8327 |
344 |
24:1 |
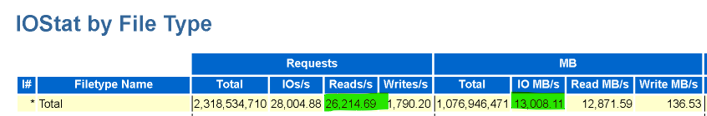
| Example #3 |
26215 |
12872 |
2:1 |
If you based the storage solution for these Oracle workloads based off the IOPS, you could make drastic mistakes on both compute as well as storage.
For Example #1, we see similar ratios set in compute for max limits on Azure compute for limits on IO:
SKU |
vCPU |
Memory: GiB |
Temp storage (SSD) GiB |
Max data disks |
Max uncached disk throughput: IOPS/MBps |
Max burst uncached disk throughput: IOPS/MBps1 |
Max NICs |
Expected network bandwidth (Mbps) |
| Standard_E2s_v44 |
2 |
16 |
Remote Storage Only |
4 |
3200/48 |
4000/200 |
2 |
5000 |
| Standard_E4s_v4 |
4 |
32 |
Remote Storage Only |
8 |
6400/96 |
8000/200 |
2 |
10000 |
| Standard_E8s_v4 |
8 |
64 |
Remote Storage Only |
16 |
12800/192 |
16000/400 |
4 |
12500 |
| Standard_E16s_v4 |
16 |
128 |
Remote Storage Only |
32 |
25600/384 |
32000/800 |
8 |
12500 |
| Standard_E20s_v4 |
20 |
160 |
Remote Storage Only |
32 |
32000/480 |
40000/1000 |
8 |
10000 |
| Standard_E32s_v4 |
32 |
256 |
Remote Storage Only |
32 |
51200/768 |
64000/1600 |
8 |
16000 |
| Standard_E48s_v4 |
48 |
384 |
Remote Storage Only |
32 |
76800/1152 |
80000/2000 |
8 |
24000 |
This is a smaller workload and we could easily go to the Standard E8s_v4 would be covering the average workload from this peak AWR that was submitted for sizing. If the vCPU and memory meets the requirements, then the IO peaks also do.
Using Example #2, where the ratio has more than halved, although the IO Requests on reads hasn’t changed that much, the MBPs (throughput) has more than doubled. We could meet the workload when bursting is available, but we really don’t want to count or pay for this and would need to size up. This is a clear case of why we lean on throughput vs. IOPs.
Example #3 is a very large Oracle workload coming from Exadata. There is considerable offloading, (smart scans) and along with flash cache scanning. With this, the IO requests are incredibly efficient, to the point that the requests vs. throughput is a ratio of 2:1. This is a workload that can only rely on network attached storage to meet its needs and would require some optimizing. There’s a reason the documentation shows both IOPs and throughput (MBPs). Make sure when you’re assessing workloads, especially Oracle, include the throughput. It may surprise you.