
After publishing my last post on Oracle Wait Classes, I received a great question on LinkedIn:
“How do you identify the SQL statement or the cause of high CPU when the top wait event is ‘resmgr:cpu quantum’?”
It’s a common (and frustrating) performance issue in Oracle. So today, we’ll walk through how to identify and troubleshoot it.
What is resmgr:cpu quantum?
Let’s break it down:
- RESMGR = Oracle Resource Manager
- CPU Quantum = The time slice a session is allowed to consume CPU
This wait event indicates that a session is throttled by Oracle Resource Manager because it’s trying to use more CPU than its current consumer group allows. This is intentional: Resource Manager is designed to prevent a single user or group from monopolizing system resources.
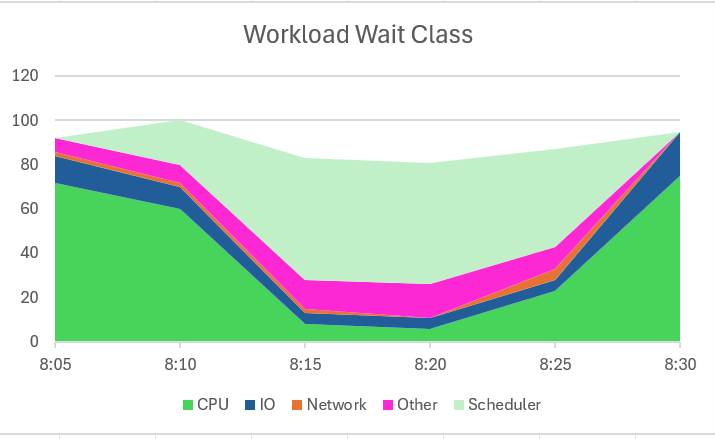
In Oracle Enterprise Manager (OEM), these throttled sessions show up as light green under the SCHEDULER wait class. This can confuse even experienced DBAs because CPU usage is usually represented in bright green. If the CPU switches to SCHEDULER waits, your process isn’t hung—it’s just being held back until it drops below its quota.
How to Identify a Throttled Process
Here’s how to diagnose when this wait event is the culprit:
User Reports Poor Performance
You receive a ticket: “The app is slow.” Time to dive in.
Check the Wait Classes (e.g., ASH Report or GUI Monitoring Tool)
You run an Active Session History (ASH) report or check your monitoring tool. CPU wait class is low, and SCHEDULER wait class spikes.
EXAMPLE ASH REPORT OUTPUT DATA
Top Wait Classes
|
Wait Class |
Avg Active Sessions |
% of DB Time |
|
SCHEDULER |
8.5 |
56.7% |
|
CPU |
4.0 |
26.7% |
|
USER I/O |
1.5 |
10.0% |
|
Concurrency |
0.8 |
5.3% |
|
Configuration |
0.2 |
1.3% |
Top Wait Events
|
Event Name |
Avg Active Sessions |
% of DB Time |
Wait Class |
|
resmgr:cpu quantum |
8.2 |
54.7% |
SCHEDULER |
|
CPU + Wait for CPU |
4.0 |
26.7% |
CPU |
|
db file sequential read |
1.0 |
6.7% |
USER I/O |
|
library cache lock |
0.5 |
3.3% |
Concurrency |
Top Sessions (Throttled on CPU)
|
SID |
Serial# |
User |
Program |
Wait Event |
Wait Class |
Consumer Group |
CPU Wait Time |
State |
|
1234 |
23892 |
APPUSER1 |
JDBC Thin |
resmgr:cpu quantum |
SCHEDULER |
APP_GROUP |
8,300 ms |
Waiting |
|
4321 |
55938 |
APPUSER1 |
JDBC Thin |
resmgr:cpu quantum |
SCHEDULER |
APP_GROUP |
7,900 ms |
Waiting |
|
4567 |
12093 |
APPUSER2 |
PL/SQL Dev |
resmgr:cpu quantum |
SCHEDULER |
BATCH_GROUP |
7,200 ms |
Waiting |
SQL IDs Associated with Top Waits
|
SQL_ID |
CPU Time (ms) |
Wait Event |
Module |
SQL Text (Start) |
|
4j2kd91mzz |
18,200 |
resmgr:cpu quantum |
JDBC Thin |
SELECT * FROM orders WHERE… |
|
aj8qz22k3p |
13,900 |
resmgr:cpu quantum |
PL/SQL Dev |
UPDATE invoice SET status… |
|
7dj3q22kkx |
12,500 |
resmgr:cpu quantum |
SQL Dev |
SELECT customer_id, SUM… |
Querying Resource Manager Plan Information
Now the ASH report gives very clear insight in what is happening in the database, but if you need to understand more about the resource manager, then it’s quick to collect this now that you know it’s the Resource Manager that the processes are impacted by.
Check Which Consumer Groups Are Queuing or Starving for CPU
SELECT name, active_sessions, queue_length,

       consumed_cpu_time, cpu_waits, cpu_wait_time

FROM   v$rsrc_consumer_group;
|
NAME |
ACTIVE_SESSIONS |
QUEUE_LENGTH |
CONSUMED_CPU_TIME |
CPU_WAITS |
CPU_WAIT_TIME |
|
APP_GROUP |
12 |
4 |
1020300 |
80 |
1823000 |
|
BATCH_GROUP |
3 |
0 |
580200 |
0 |
0 |
If QUEUE_LENGTH, CPU_WAITS, and CPU_WAIT_TIME are high, you’ve found your bottleneck.
See Which Sessions Are Waiting
SELECT se.sid SESS_ID, co.name NAME,

       se.consumer_group CONSUMER_GROUP, se.state STATE,

       se.consumed_cpu_time CPU_TIME, se.cpu_wait_time CPU_WAIT_TIME,

       se.queued_time QUEUED_TIME, se.dop DOP

FROM   v$rsrc_session_info se

JOIN   v$rsrc_consumer_group co

  ON   se.current_consumer_group_id = co.id

WHERE  se.state = 'WAITING';
|
SESS_ID |
NAME |
CONSUMER_GROUP |
STATE |
CPU_TIME |
CPU_WAIT_TIME |
QUEUED_TIME |
DOP |
|
123 |
APP_GROUP |
APP_GROUP |
WAITING |
290000 |
830000 |
123000 |
1 |
|
456 |
BATCH_GROUP |
BATCH_GROUP |
WAITING |
120000 |
450000 |
89000 |
1 |
These are the sessions that are actively throttled by the CPU quota limits and should be investigated.
Other Items to Check
It may be important to exclude any changes to the database environment. Although we want to believe the database hasn’t experienced any changes, it is important to ensure there hasn’t been a change and realizing the architecture could impact the responses to our queries.
Single Instance or Multitenant?
If you’re using multitenant (CDB/PDB architecture), switch your views to the V$RSRC_PDB* set to get accurate metrics per PDB.
What Resource Management Plan is Active?
SELECT sequence# seq, name plan_name,

       TO_CHAR(start_time, 'DD-MON-YY HH24:MI') start_time,

       TO_CHAR(end_time, 'DD-MON-YY HH24:MI') end_time,

       window_name

FROM   v$rsrc_plan_history;
Sample Output:
|
SEQ |
PLAN_NAME |
START_TIME |
END_TIME |
WINDOW_NAME |
|
20 |
ORA$AUTOTASK |
07-MAY-25 22:00 |
08-MAY-25 02:00 |
NIGHTLY_WINDOW |
|
21 |
APP_QOS_PLAN |
08-MAY-25 02:00 |
(active) |
WORK_WINDOW |
Check if the currently active plan is appropriate for your workload.
Is CPU_COUNT Artificially Limited?
SHOW PARAMETER cpu_count;
Make sure it reflects the actual CPU available to the instance. Some environments (especially VMs or containerized deployments) might under-report CPU, artificially constraining performance.
Final Step: Identify the Offending SQL
Once you know which session is being throttled, link the session to its SQL:
SELECT sql_id, sql_text

FROM   v$sql

WHERE  sql_id IN (

  SELECT sql_id

  FROM   v$session

  WHERE  sid IN (<SESS_ID from previous query>)

);
This gives you the exact query that is using excessive CPU or is frequently throttled. From there, you can decide:
- Should I tune the SQL?
- Should I change the consumer group or adjust the resource plan?
- Is it time to increase CPU limits for this group?
Summary
When the top wait event is resmgr:cpu quantum, you’re not looking at a CPU shortage—you’re seeing CPU control in action. Oracle is doing what it’s configured to do: manage limited resources fairly. Your job is to decide whether the current settings match business expectations.
By tracking the active consumer groups, throttled sessions, and SQL involved, you can make informed decisions to either tune the application or rework the resource allocations.
One comment on “Troubleshooting ‘resmgr:cpu quantum’ and High CPU in Oracle”
Comments are closed.