
Power BI, like many Microsoft products, is multi-threaded. This can be seen from the logs and even the Task Manager. I know, I know…you’ve probably heard this part all before…

The importance of this information, is that the logs will display Process IDs, (PID) that are separate from the main Power BI Desktop executable, including the secondary processes.. Moving from the Power BI logs that reside in the Performance folder, (see Part I here) we can view and connect the PIDs and TID, (Transaction IDs) to information from the Task Manager and the data displayed:
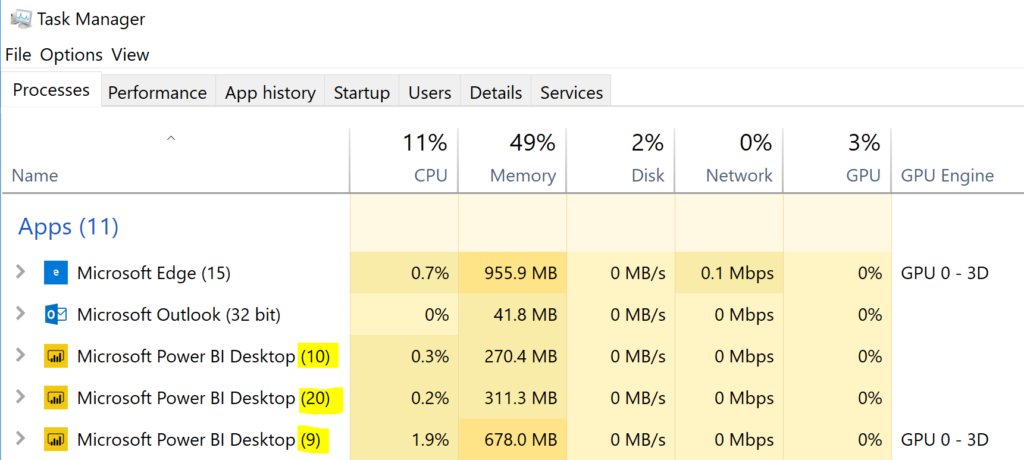
Note that I’ve highlighted the thread count in the image above and we can see the total resource usage, but if we want to see it broken down, we can simply expand the left hand arrow to the application name:
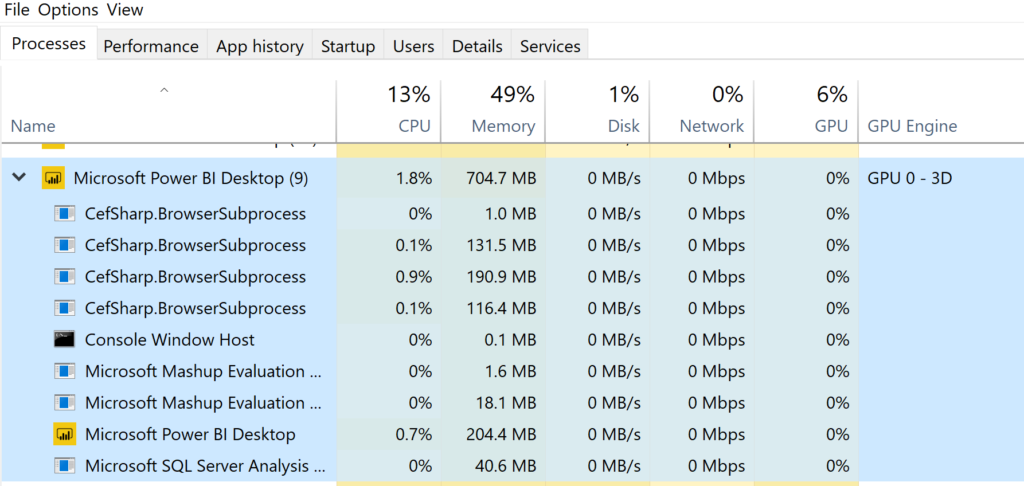
We can see that there are numerous threads, with a few taking considerable memory over others- The CefSharp.BrowserSubprocess can be a bit misleading- It’s Power BI using Chromium to render the visuals that are part of the Power BI Desktop that’s part of the current run. Chromium (CefSharp.BrowserSubprocess) subprocesses will always come in pairs, one for rendering and one for messaging.
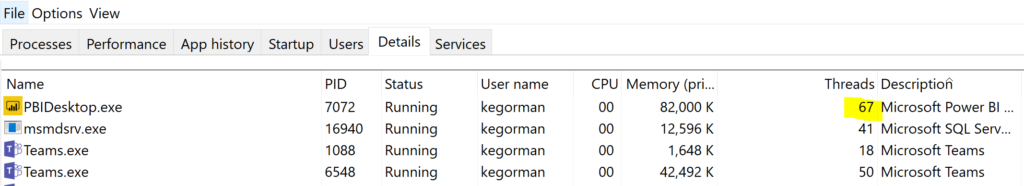
In the Task Manager Details, we can see each of the PIDs that correspond with the processes IDs listed in the logs. By updating our viewable columns, (right click, choose “threads” and click OK) you can now view how many threads are associated with a given PID.
In the main view of the Task Manager, you can do something similar, right clicking in the top tabs and choosing to display the PID, the process type, (to verify what is what) and the executable to pair up entries in the log with the Task Manager.
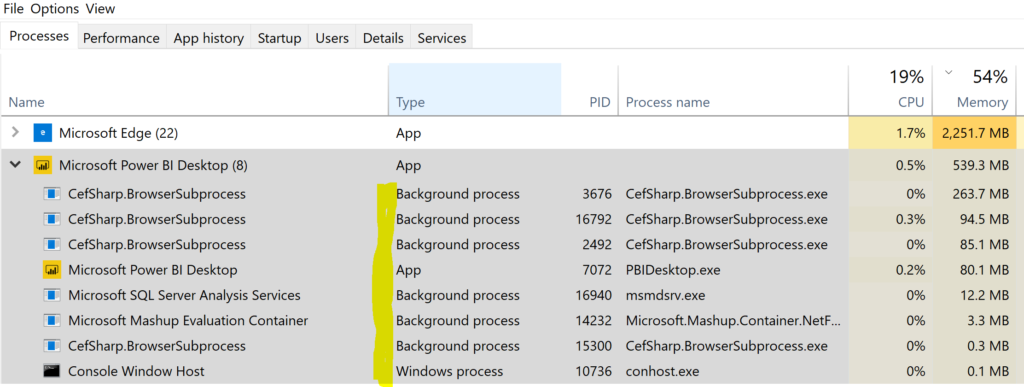
The SQL Server Analysis Service, the Windows console host and Power BI application subprocess are visible in the list as well. Different types of Power BI data models, depending on the data sources, features and functions will effect what subprocesses are required to satisfy the demand. By viewing them in the Task Manager, it helps identify what processing requires heavier resources. This is just another step, another view into what’s going on behind the scenes with Power BI.
One comment on “Power BI 101- Logging and Tracing, Part III”
Comments are closed.