
January is winding down and RMOUG Training Days 2015 is just around the corner, taking up much of my after work hours.
With that, we are going to discuss a great performance console in the EM12c cloud control- Cluster Cache Coherency.
Cluster Cache Coherency
Optimization for an Oracle Real Application Cluster, (RAC) can be a daunting tasks for those that aren’t familiar with some of the most common issues to look for. Although many aspects of a single instance must always be examined, knowing what is unique to RAC is important. Be aware that Enterprise Manager is completely RAC Aware and will provide you with much of the data that you need to research, identify and resolve performance issues unique to clusters.
Accessing the Console
Once you’ve logged into a RAC instance, you can access the console from the performance menu:
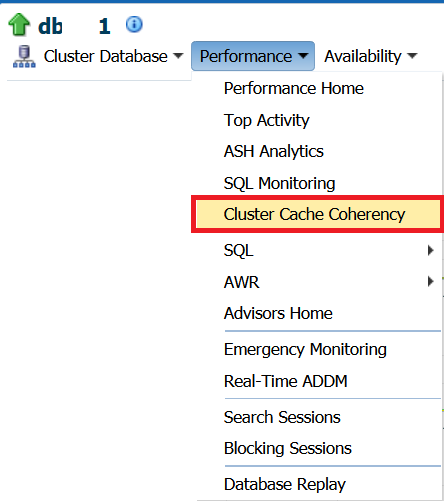
The interface is broken down into multiple areas:
-
Global Cache Block Access Latency
-
Global Cache Block Transfer Rate
-
Block Access Statistics
You can view this data in Graphical or Tabular view, with the graphical view as default. I find the graphical view to be much more informative, as it shows more details and breakdown by time, where the tabular view is a snapshot of information rolled up.
Tabular View
By Clicking on Tabular view, you are going to see, (as explained earlier) the rolled up estimates for the time shown in the for the snapshot of time displayed in the graphical view:
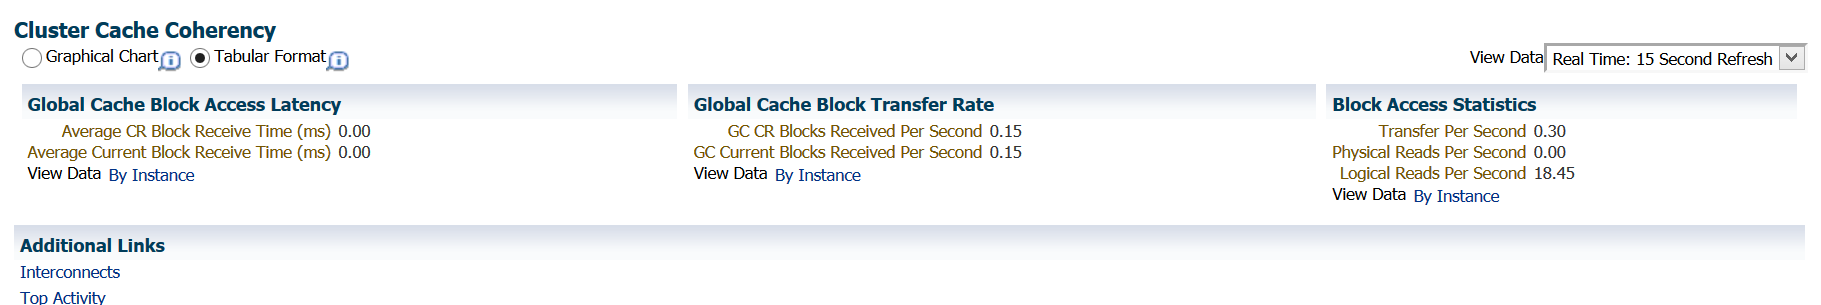
Along with the three categories of data showing the averages for each, you can view the data per instance, which is extremely important to see if transactions and resource usage is askew per node.
Below the global cache info is Additional Links to Interconnects and Top Activity performance pages, the two areas that are most likely accessed next for deeper research.
Graphical Charts
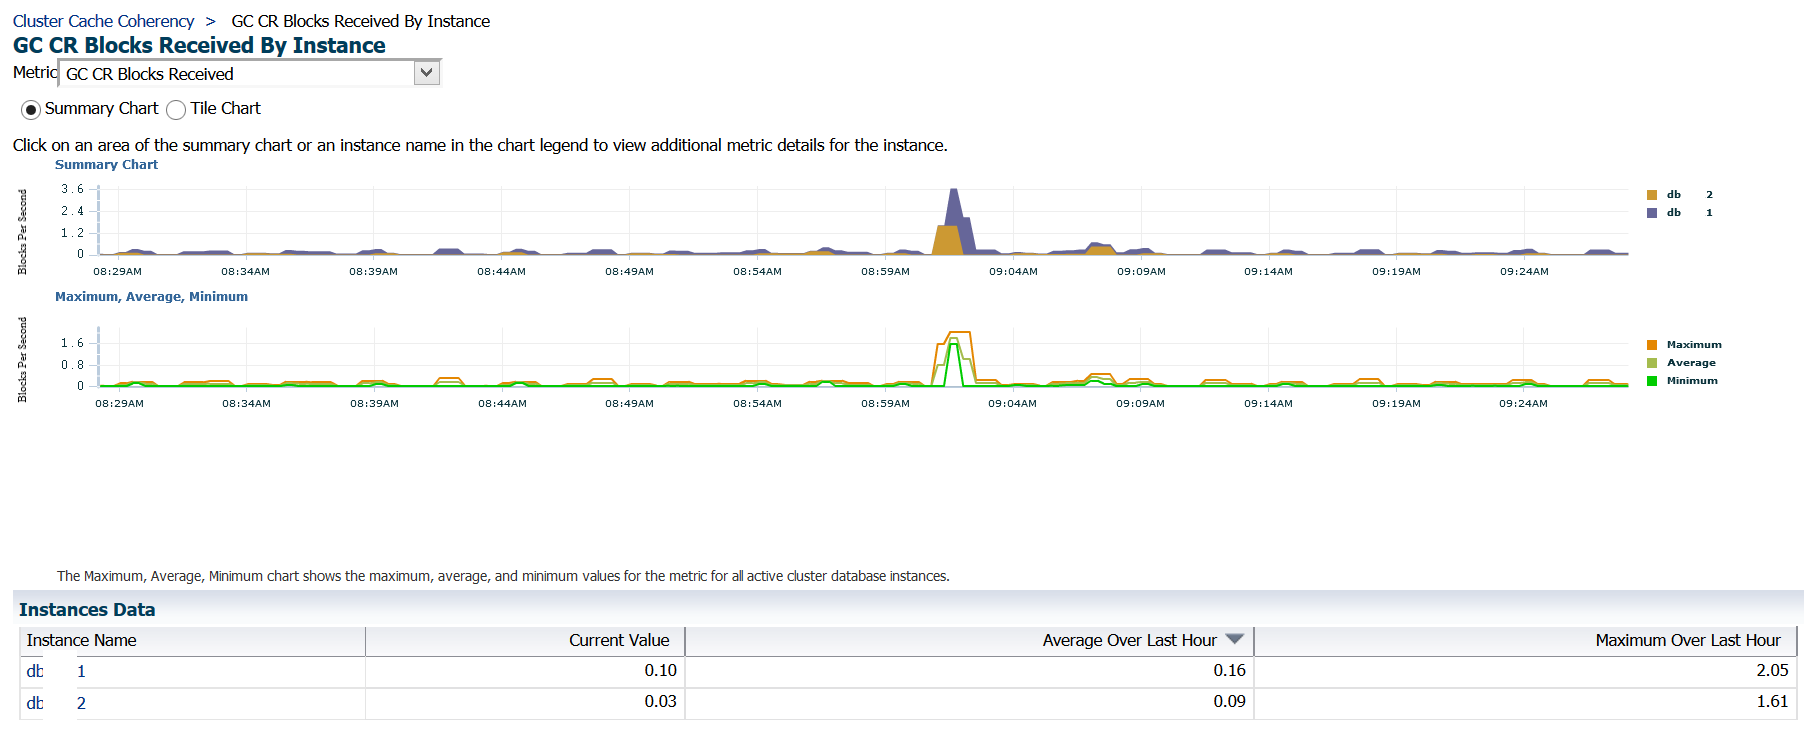
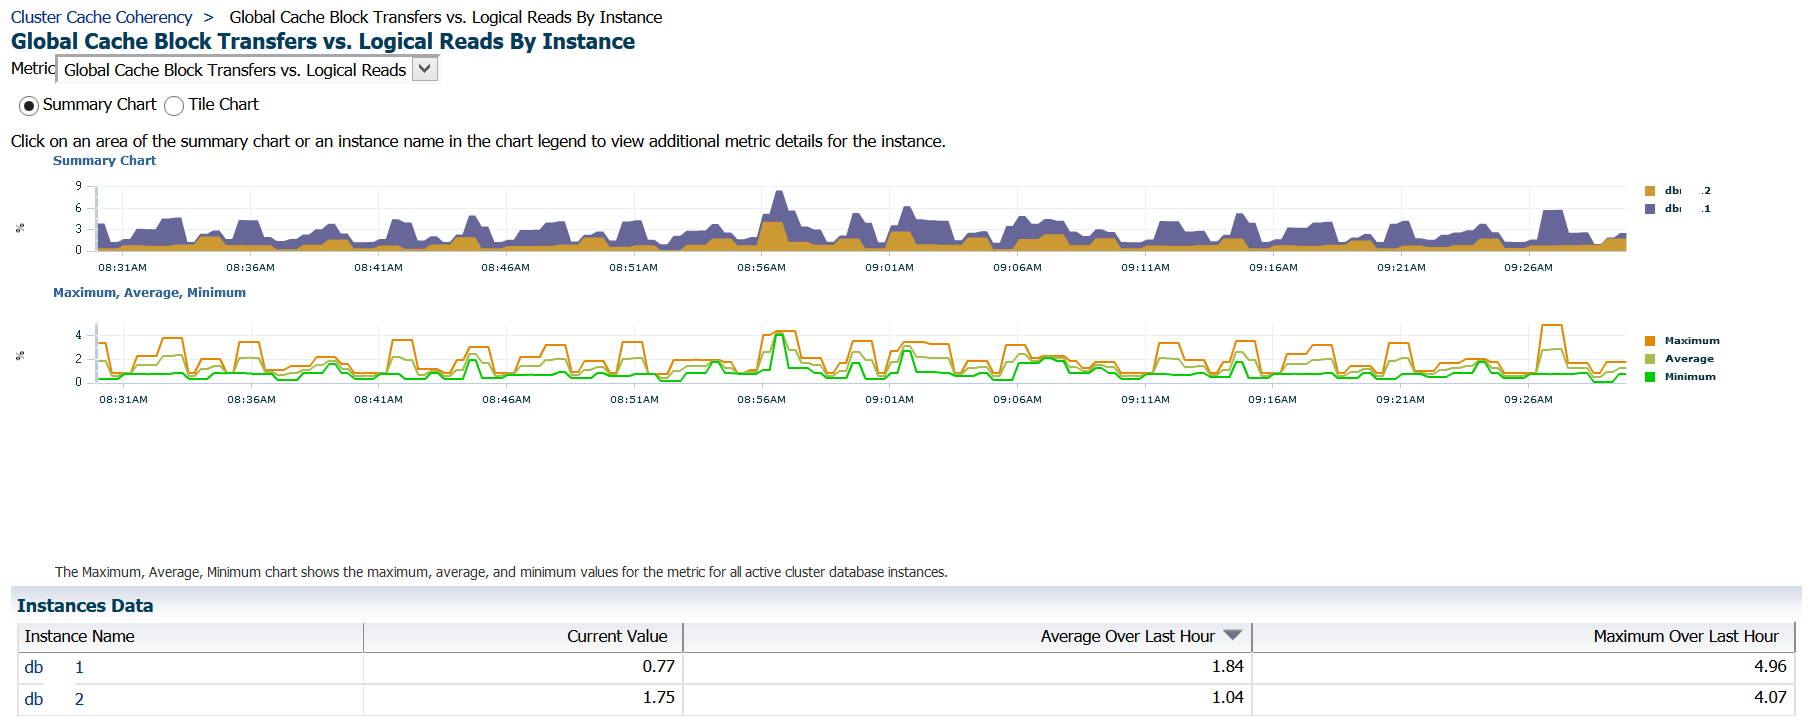
By changing back to a graphical chart view, the console extends to display each of these three categories, displaying global cache information by time.
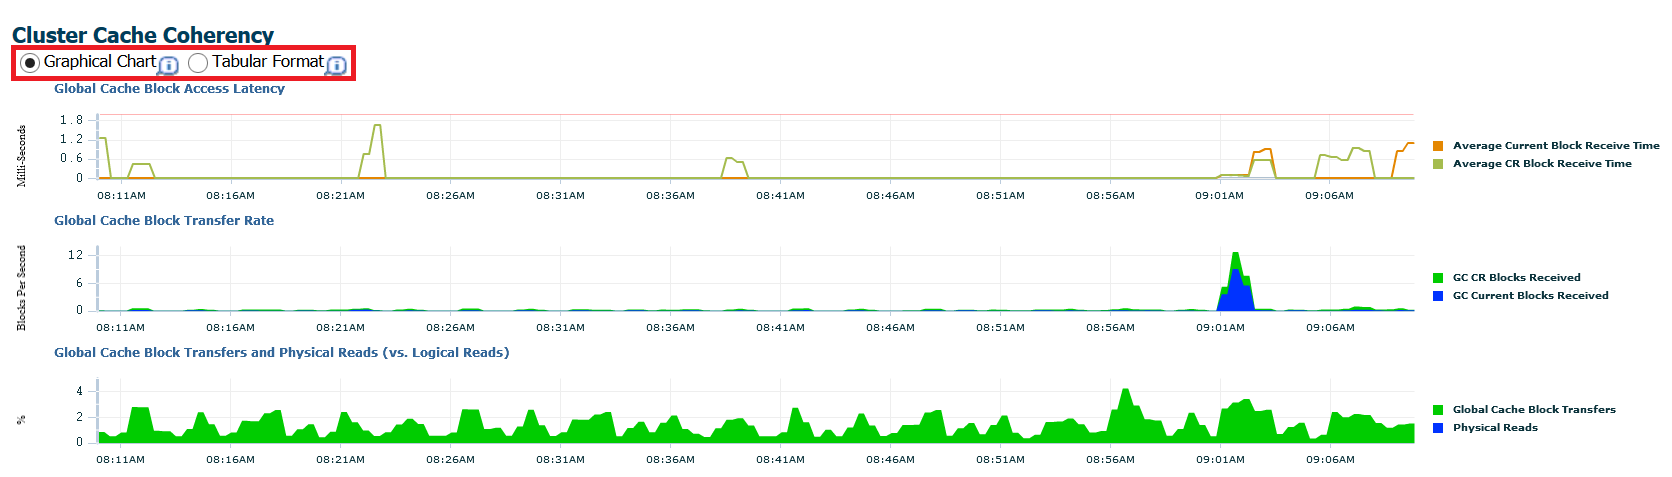
Notice by each of these three graphs for the Cluster Cache Coherency, how the average Current Blocks Received and CR Blocks Received Time is measured in milli-seconds. GC, (Global Cache) values are measured by blocks per second and Physical and Logical read comparisons are shown in IO Per Second, (IOPS).
Breaking it Down
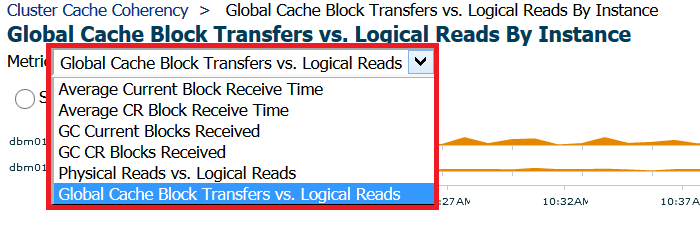
You can highlight any of these metrics and click on them in the right hand side to show more detailed data for each:
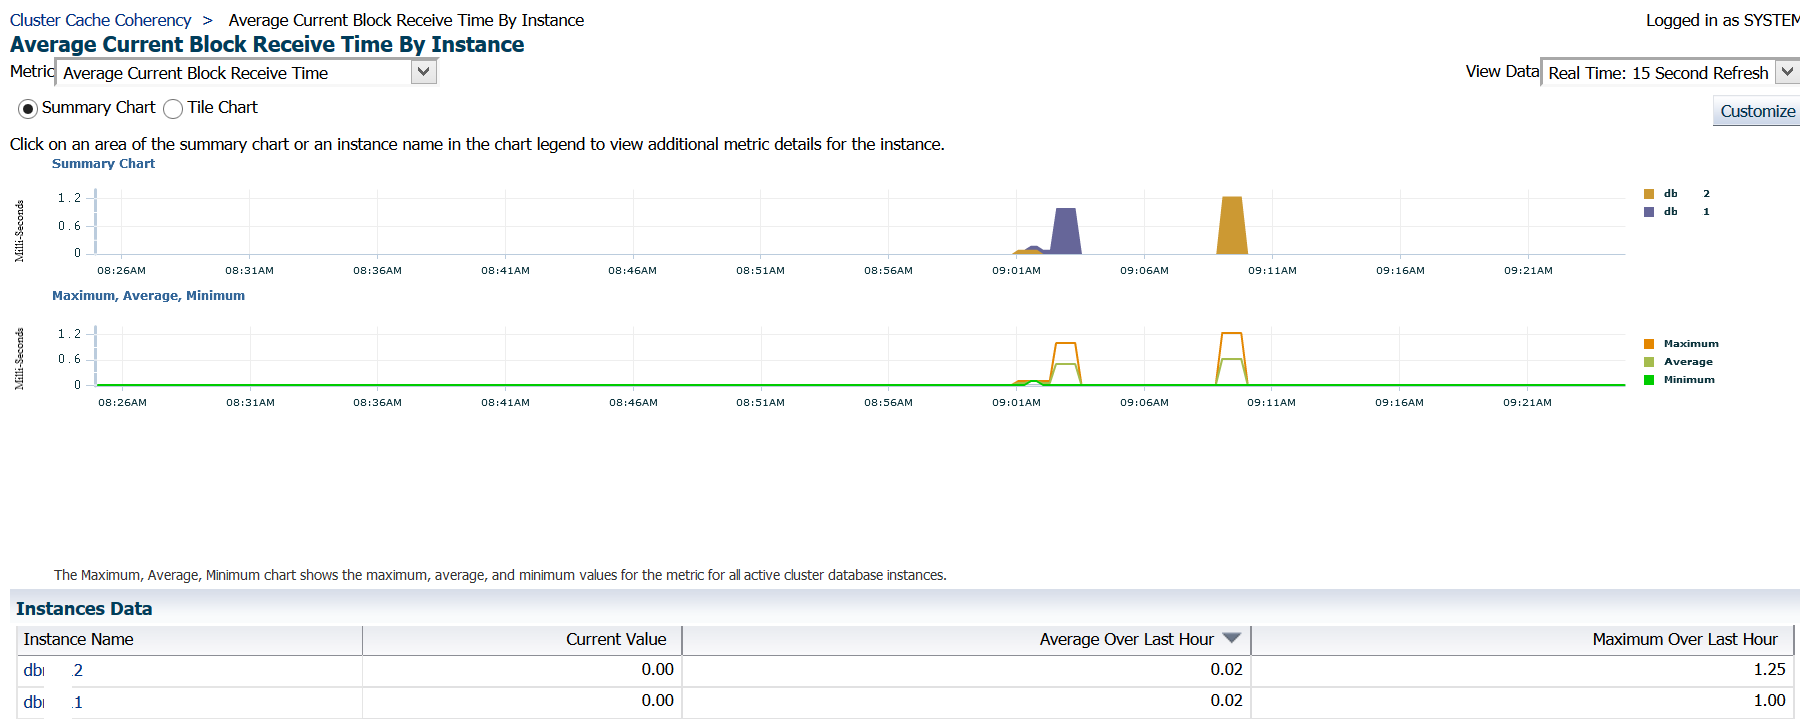
You can also click on any of the metrics shown on the right, and break down exactly what objects are cached per node:
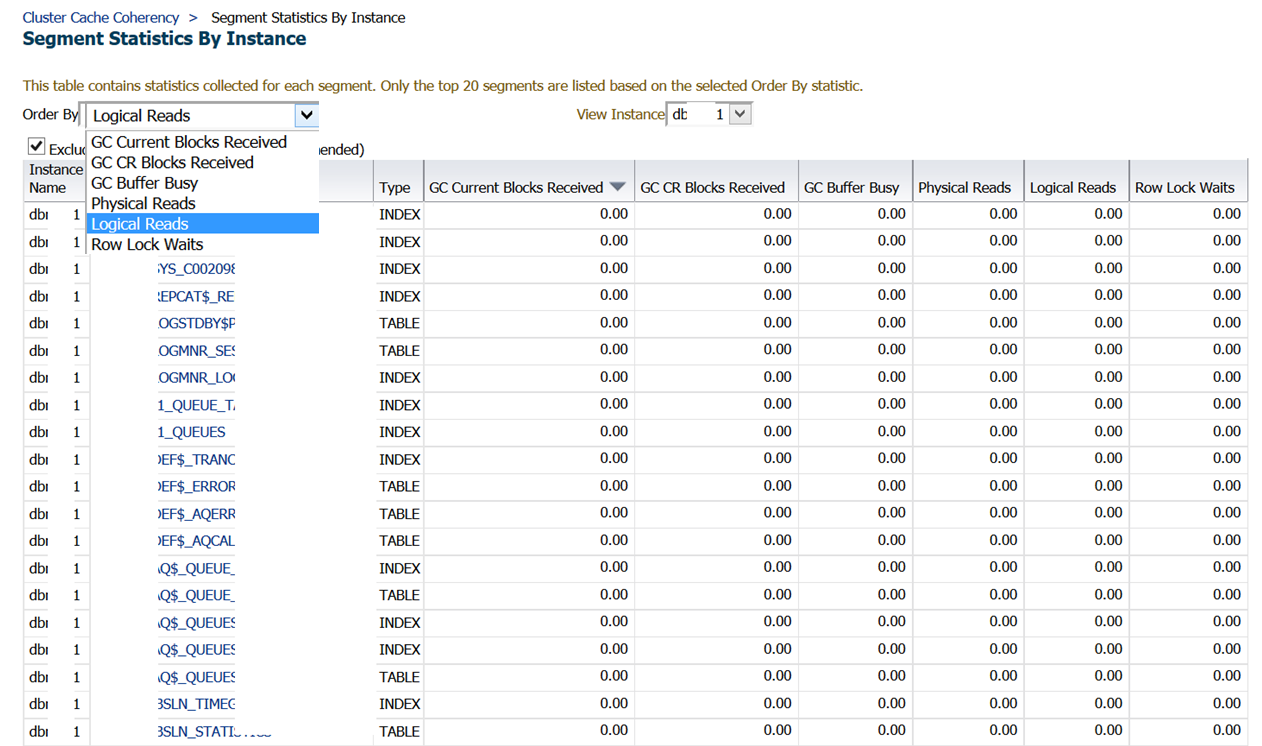
With the instance/node view, you can see what objects are cached per instance, switch to another node in RAC or order the data by different metrics:
- GC Current Blocks Received
- GC CR Blocks Received
- GC Buffer Busy
- Physical Reads
- Logical Reads
- Row Lock Waits
This view can offer a lot of data when trying to drill down and find out what object may be causing concurrency or block wait issues across different nodes.
Tile Chart View
You can adjust the Summary Chart to a Tile Chart view, too:

There are, (again) a number of different ways to view this data between the nodes to see resources are being allocated in the cluster:
Once you have investigated and found what object or interconnect issue is causing your waits, you can then use the Additional Links section to further research and resolve performance issues. Interconnect for cluster interconnect related issues and Top Activity for database issues, but I would highly recommend checking into ASH Analytics or ADDM Comparison for enhanced features to get the most out of EM12c. Both features are available in the Performance drop down in the target console!


One comment on “Cluster Cache Coherency in EM12c”
Comments are closed.