
So we went over locations and the basics of logging and tracing in Power BI. I now want to know how to make more sense from the data. In Oracle, we use a utility called TKProf, (along with others and a number of third party tools) to make sense of what comes from the logs. SQL Server has Log Analytics and the profiler, but what can I do with Power BI?
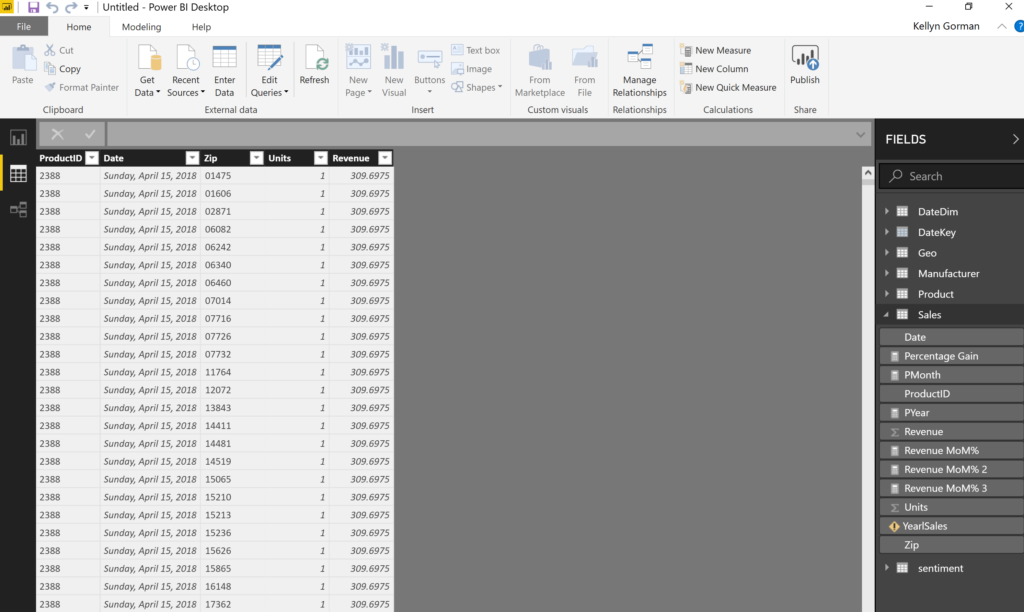
First, let’s discuss what happens when we have actual activity. In my first post, the system was pretty static. This time I chose to open up a file with larger data refreshes from multiple sources, added tables, calculated columns and measures. The one Access DB has over 10 million rows that is refreshed when I first open the PBIX file:
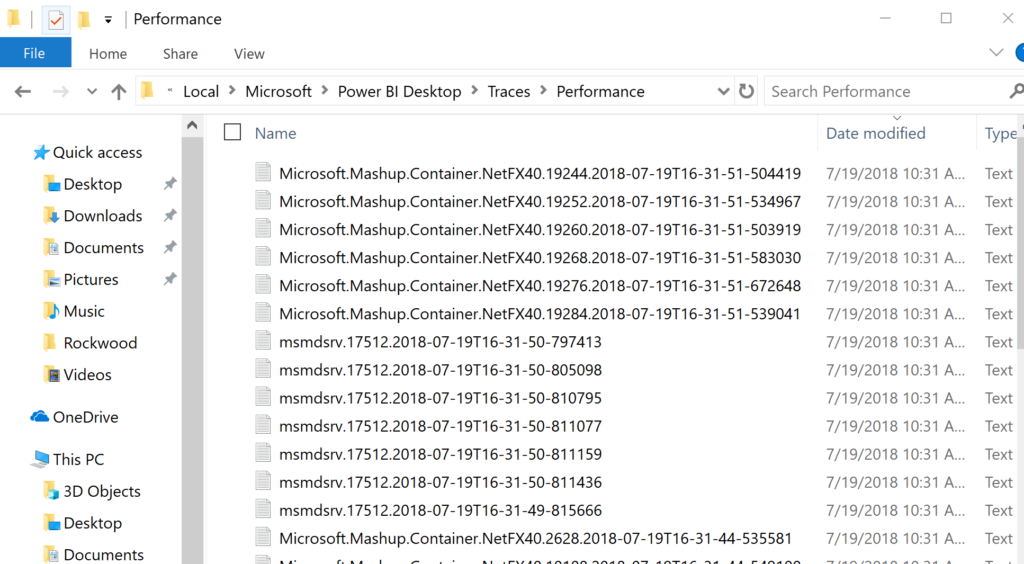
Post loading, there’s a significant increase in number of MS Mashup Container, (calculations and measures) and msmdsrv, (data loading) logging:
Do I really want to go through all this data by hand? BI is a reporting tool, so what if I bring them into Power BI? Let’s start with the first MS Mashup Container log-
In Power BI, click on Get Data –> Text and change the file type to “All Files” in the explorer and go to the directory that contains the trace files:
C:\Users\<user>\AppData\Local\Microsoft\Power BI Desktop\Traces\Performance
Remember that you will need to have “hidden items” set to be displayed to browse down to this folder. Choose the files you wish to load in the directory and Power BI and choose a Customer delimiter of a quotes, (“) to separate the file. This will load a file that will have a few columns you’ll need to remove that contain data like colons, nulls and other syntax from the file. Once you’ve completed doing this, you most likely have a table with 15 columns of valuable data:
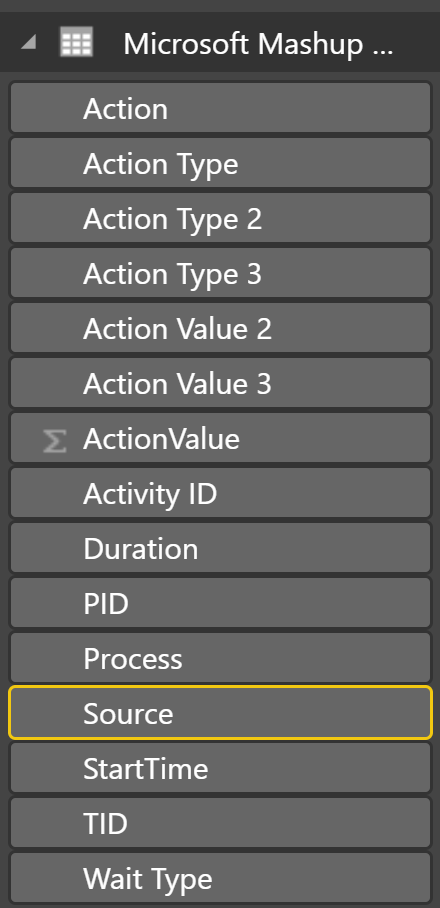
I’ve renamed the columns to something more descriptive and I can now apply these changes and pull some value from the data.
Using the provided data, I can then produce a report that tells me about what types of processes are the largest users of resources and time. I can provide reports to grant a visual on what’s going on in a Power BI environment. The report is pretty straightforward- Wait events against percentage of waits, Memory allocation over time, Time Waited and Wait Count. These reports may seem really foreign for most data scientists, but for a DBA, it should resonate and provide them with ways they can offer assistance to the Power BI group in optimization.
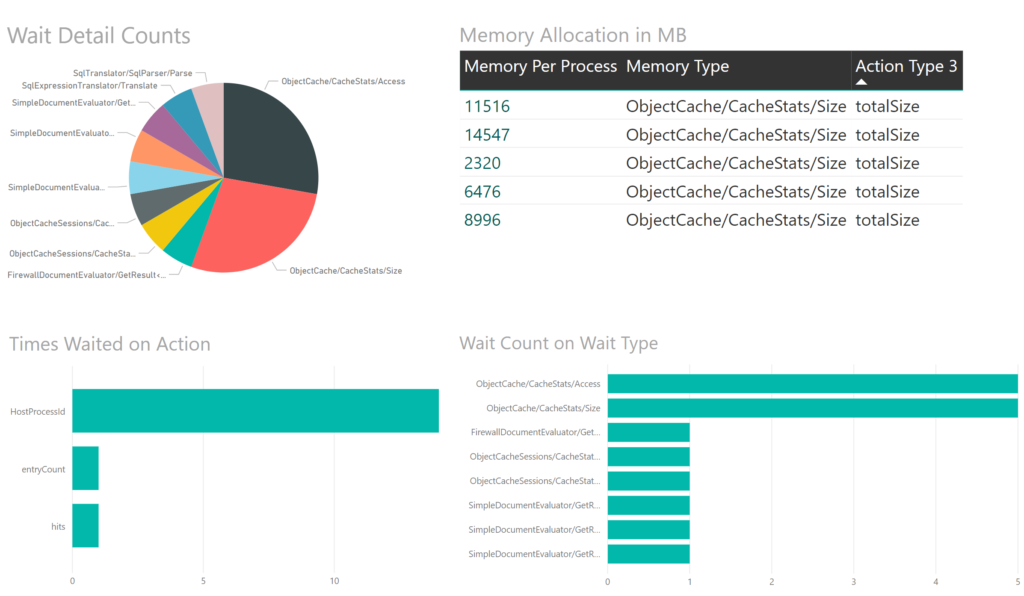
I can add hierarchy to this to drill down into interesting areas of waits and add more files, identifying each table by the file unique identifier and date that it came from going forward. I expect my reports and my direction to look different from the direction many have taken with Power BI performance, but I wanted to demonstrate that optimization is always about time. I admit fully that I’m still learning, but I also am approaching this from a database optimization perspective. Please let me know your thoughts?
Happy hunting, folks!
One comment on “Power BI 101- Logging and Tracing, Part II”
Comments are closed.