*Previously on the Microsoft Tech Community Data Architecture Blog
A number of our customers and my peers have asked me how to use the Excel sizing template to estimate an Oracle workload without access to the AWR. This is actually quite easy to do with Oracle Statspack.
The statspack report is the predecessor to the Automatic Workload Repository,(AWR). It is also the option for those databases that are Oracle standard edition or are enterprise edition but haven’t licensed the diagnostic management pack. This product requires a manual installation that requires either manual snapshots be taken or scheduling via cron or another scheduler. As it’s not “always on” and it didn’t have many of the great advanced features we take advantage of today that are part of the AWR suite. At the same time, we can use this for sizing out standard edition databases to migrate to Azure. AWR requires the diagnostic management pack to be licensed and as this is only an option on the Enterprise Edition of Oracle, so statspack is the go-to for performance data on most Standard Edition Oracle databases.
To perform a sizing assessment for Oracle to Azure on a Standard Edition database or for an Enterprise Edition database that doesn’t have the diagnostic pack licensed, a one-week snapshot window is requested. If a reboot of the server occurs during the snapshot window, the report will fail, so keep in mind that the server must be running throughout the duration of the snapshot window.
The Statspack Report
Unlike AWR, statspack is installed and owned by the PERFSTAT user. By default, app statspack processing is performed by this user. There are packages and stored procedures, etc. that are part of the installation of statspack that can be used to take snapshots and run reports.
To take a manual snapshot with statspack, the following command is run after logging into the database from SQLPlus as the perfstat user:
exec statspack.snapThis can be scheduled through cron to execute as part of a shell script one week apart to offer a single report for sizing. Another manual snap can then be performed to grant us the beginning and ending snapshot to run the report.
The reports for statspack are still housed in the same directory as the command line reports we use for AWR. We can issue the report with the following command:
@$ORACLE_HOME/rdbms/admin/spreportThe report will interactively ask you for the same type of information that is requested for AWR, just choose to show all snapshots and use the one-week previous snapshot and the ending week snapshot to create the single report.
Once this is created, the report can then be used, just like the AWR to size with the following worksheet. The instructions and data you will collect is the same, but the format of the data may just need a few hints to locate in this text formatted report for statspack.
Using the Statspack Report with the Sizing Worksheet
The example we’ll use is for a RAC database. There isn’t a RAC aware report in many databases using Statspack, so I’ll use two instance level reports and consolidate it to a single instance in the example going forward.
The data we will need to pull for our database to translate it to Azure is the following:
- Database name, instance name, host name
- Elapsed time, DB Time
- DB CPUs, CPU % Busy
- CPU/Cores
- SGA/PGA
- IOPs/MBPs
For this post, I’m going to use a real-world example, but have just done a global replace on the customer data to hide any identifying info and am only displaying the data points we require for the sizing estimate.
The report will open up in a multitude of text editors, but Wordpad or Visual Studio are the most common applications you can open the report in. Upon opening it, you may notice the database name is missing. The truth is, you only need an identifier to be used for the consolidation to a single instance from RAC:

To address this, most database names are simply the instance name without the numbering. In the example, the instance name is SCANDI1. For the spreadsheet, I’m going to use the identifier of “SCANDI” for the database name, even though none is shown in the report.
I will use the Instance name as it is shown in the report.
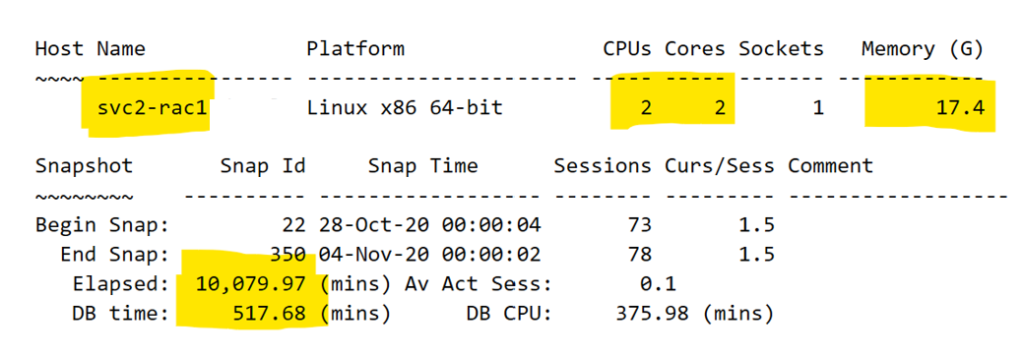
The next section we will inspect in the report is the host name and other pertinent data:

Rarely do we need the domain information for a host, as it’s really just the identifier. I choose to use the short name for the server to save me some typing. I also have the CPUs, Cores, memory, (displayed in GB, which is what we want for our worksheet) and then the elapsed and DB time for the report. As you may notice, a one week report for snapshots is approximately 10080 minutes. Depending on the exact snapshot completion, the time won’t be exact. This isn’t an issue, but do recognize that the amount of DB Time is important. The less busy a database is, the lower the number, busier the database, higher the number and yes, the number can be much higher than the elapsed time.
Enter these numbers in the fields for those columns and proceed into the next part of the report.
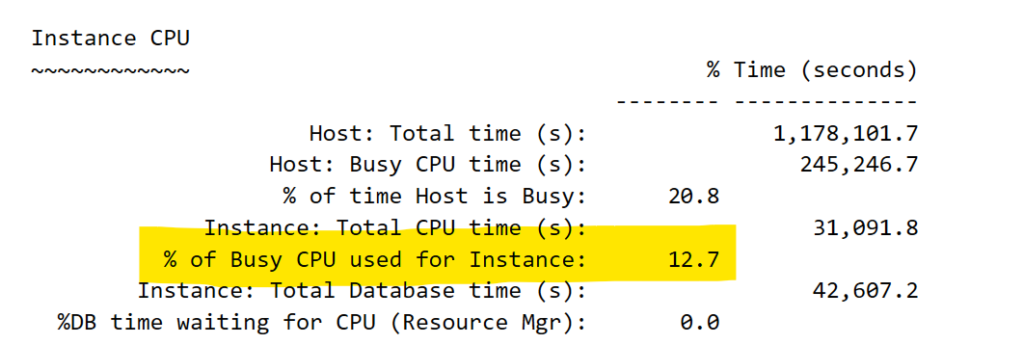
The next step is to capture the % busy CPU, which is present in Statspack, but displayed with a different identifier:

At this point, your worksheet should look like the following:
![]()
As data is presented in a different order, depending on the version of the AWR/statspack and database version, don’t be concerned that you still don’t have the DB CPUs or other data- we’ll collect that next.
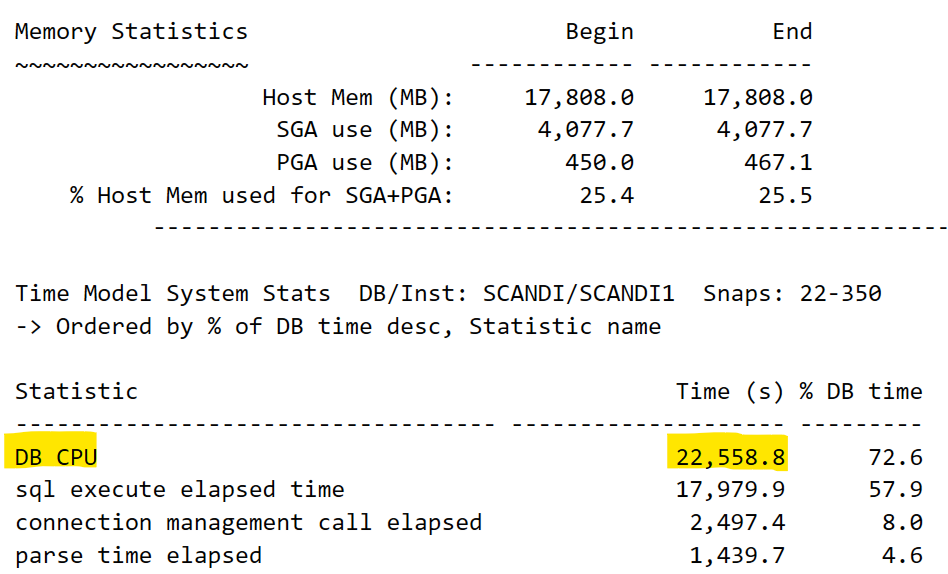
Next we come to the SGA/PGA in the report. As these numbers can change over time, there is a beginning and ending value for this and we will want to take the HIGHER of each number. Although the SGA doesn’t change often, the PGA is often different:

The highlighted numbers show the ones we’d want to take from our example into the spreadsheet.
Right below the Memory information is the DB CPU value that you require for this report. In the AWR report, this term can be used repeatedly, but this is the value that you are searching for:

The value in the Time Model System Stats is the correct one for our worksheet and the number is expected to be a HIGH percentage of the DB Time. For a database server, the CPU is either on or off, so so the percentage value is a bit of a bizarre concept. In the example above, 72.6 % of the DB Time, the CPU was on, but while that occurred, keep in mind, that SQL was executing during 57.9% of the DB Time, too. These percentages are not expected to equal up to 100%. It’s the percentage they were active of the total DB Time.
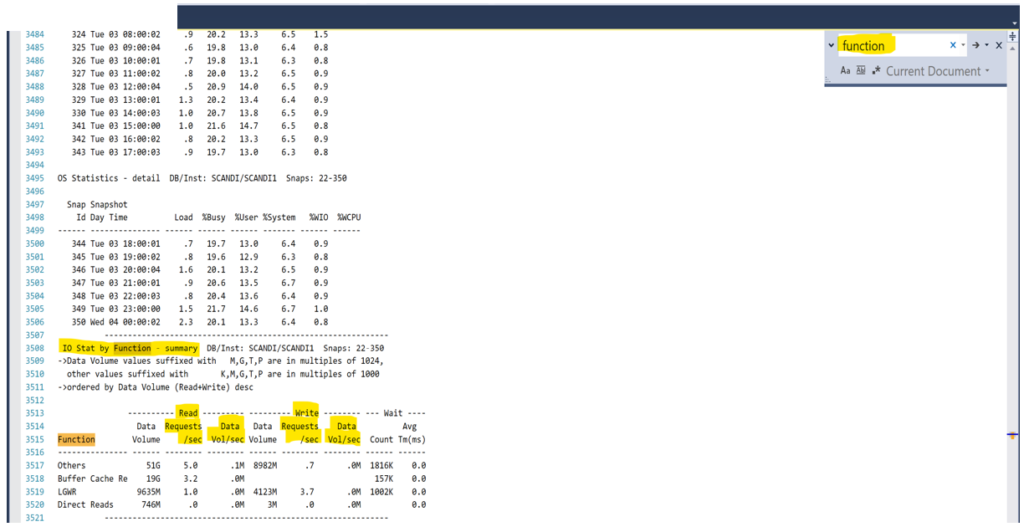
The IO Time is not towards the top of the report and as this is a text report, I highly recommend you search for the section vs. parsing through the rather large report. Click on Edit à Find or Replace à Quick Find and do a search for “function”. The search should take you to the following section rather quickly, (unless they have code that is in the report with the word function in it, this is still the fastest way to locate this section, I’ve discovered.)

The IO Stat by Function Summary is the section we need and there’s one serious drawback to Statspack vs. AWR- the data isn’t totaled for each function type. You will need the Data Vol by seconds for reads, then writes and sum the four values displayed, then do the same for writes for it’s three volumes. As there are 0.00 writes, put that value in, do not leave it empty. Next, add up the Read Requests, (IOPs) and the Write Requests and enter those values to complete the last fields for the first instance.
The finished fields for the first database instance from the statspack report values should look like the following:
![]()
Now do the same for the second report for the second instance. The database name stays the SAME as it was for the first database. This is how we will then consolidate it to a single instance, using the database name.
Once you repeat what we did for the first database, for the second, you now have something that looks like the following:

Notice that the database is the same and the instance name and host names are different. Note also the slight differences in the rac nodes in usage, even though the time collected was very similar. This is expected, including differences in PGA. Process Global Area, (PGA) is used for sorting and hashing, (along with other things) and depending on the workload, could be used differently between the two nodes. These are quite small databases by Oracle standards, but how do we now use the worksheet to translate this to Azure sizing?
Filling in the Azure Calculations
Copy the database and instance name from the AWR worksheet in the Excel spreadsheet and then paste it into the first table in the Calculations sheet titled, “Calculated Detail by Database”. Don’t fill in anything past the first two columns. If you click in any of those fields to the right, you will see that they are already pre-filled with calculations that will take what you put in the first two fields, pull from the AWR worksheet and perform the first step of the translations to Azure.
If you’ve done this correctly, the values should auto-populate to the right of the database and instance names you’ve entered or pasted in:

Next, take the host name(s) and paste them into the first column of the second table, titled, “Aggregated Calculations by Host”. Again, once you do this, the rest auto-calculates and you should have something that looks like the following:

*If you have more databases or hosts that there are lines, you can copy/paste/insert more lines into the worksheet to include a larger data estate.
For the last step, take the unique database name and paste it into the third table, titled, “Aggregated Calculations by Database”. As this is a RAC database, I’m only going to enter SCANDI once and the following example should be the output:

As there are averages, a one-week workload that may be missing a month-ending peak, along with vCPU translations, the values you will take for sizing are highlighted in red text and yellow highlighter. How this is read is:
- DB Name: Single database instance that will be built in Azure
- % DB Time of Elapsed Time: How busy the database is
- Total vRAM consumed only by Oracle: Just what the database needs in RAM.
- Est’d Azure vRAM for server: Amount required for a single VM to run the database and can be adjusted some when more than one database is consolidated to a single VM.
- Total IOPS/Total Throughput(MB/s): This is what the database is producing in IO from the workload.
- Est’d Azure IOPs/MB/s for peak load: This is the adjusted volume of IO that should be expected in Azure.
- Est’d Azure vCPU: this is how much vCPU is required to run the current workload
- Est’d Azure vCPU for peak workload: This is the recommended minimum vCPU for Azure for the Oracle database.
This should be done for each database in consideration for a migration to Azure and can often save customers from the dreaded spike in licensing requirements when Oracle informs them it will be a 2:1 penalty to go from cores to vCPUs. This instruction was focused on how to use a statspack report for Azure sizing and is not the same as complex use cases that may require more insight, but this is a great starting point to explain how we can use Statspack to size out standard edition Oracle databases for Azure.


