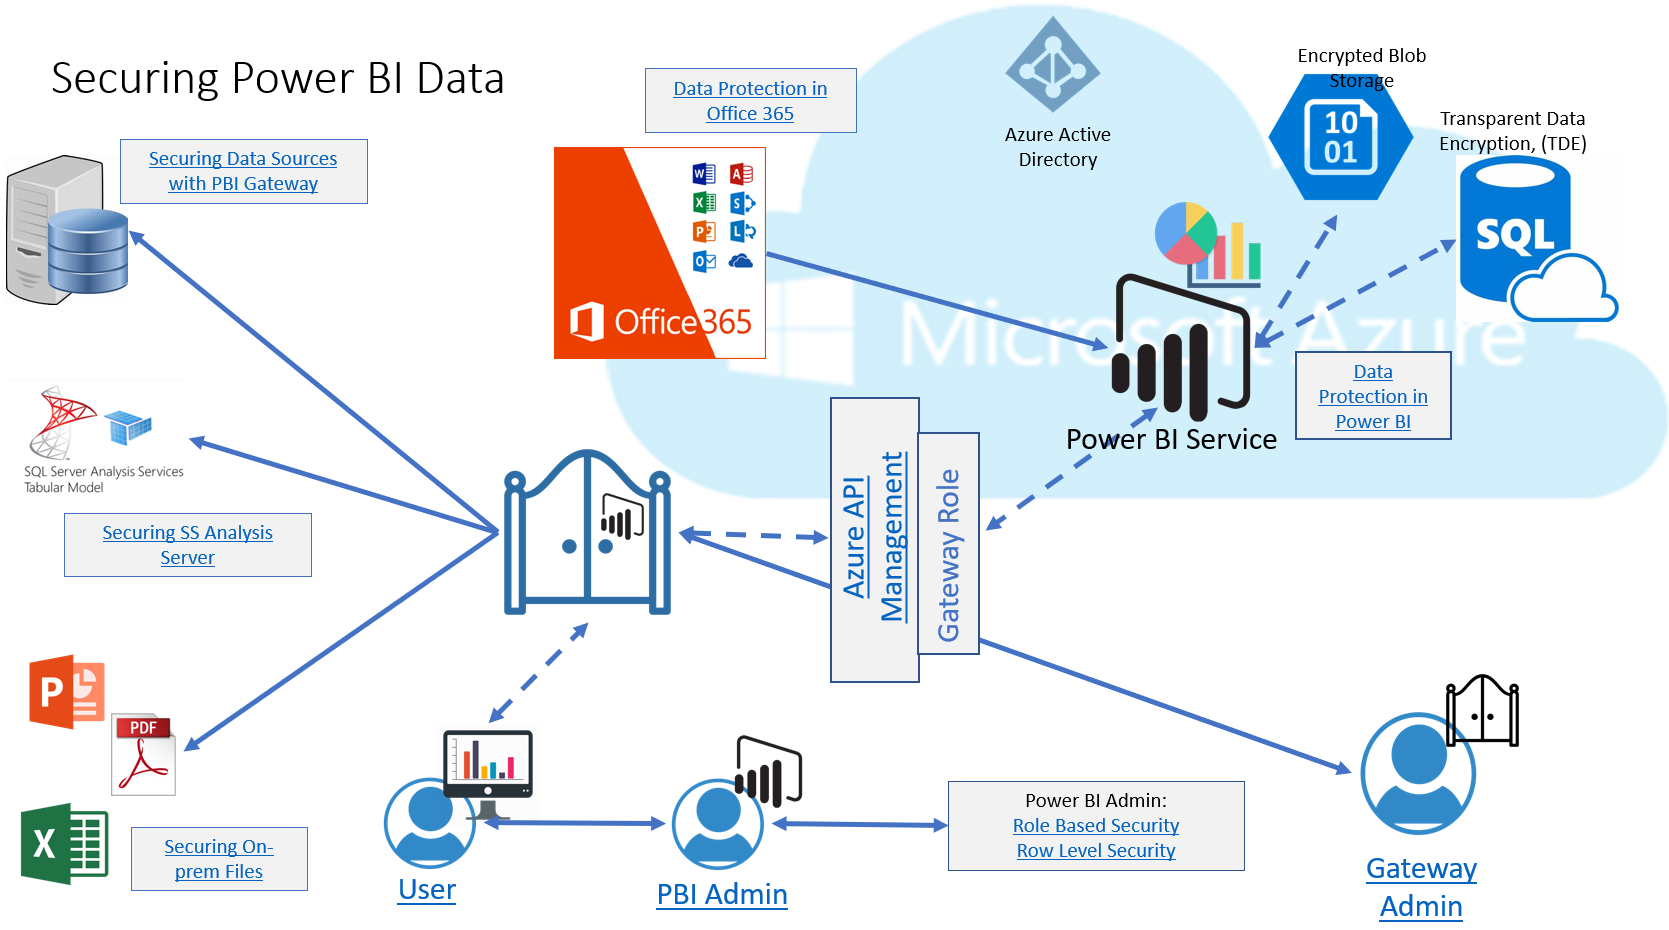
I haven’t been very good at sharing my analytics work as often I feel others are more skilled in this area than I am, just starting out, but today I’d like to start to fix that by sharing an interactive diagram. I know, some of you may be saying, “infographic”, but as it’s has links vs. a paginated design, I’ll call it as I see it. Not the Kitchen Sink This diagram I built for a customer who was interested in how data was secured at different stages of the Power BI environment and was built with their specific Power…
-
-
I’m curious by nature and many have shown interest when I connect Power BI to the SQL Profiler to collect performance information, but if you can do that, what happens when you connect it to the SQL Server Management Studio, (SSMS)? That can seem quite foreign, but if you can connect it to the SQL Profiler, you can connect it to the SSMS. Why you can do this is clearly understood when you begin to look underneath the covers of the PBIX file and the processes that run from your desktop. The PBIX File All Power BI files end with…
-
So Tracy Boggiano told me about the great First Responder kit that Brent Ozar had available to use with sp_Blitz using Power BI desktop for a UI, but that it was really slow to non-responsive as data grew. As this was focused on performance data and also included my new love of Power BI, I asked to take a look at it. Tracy was kind enough to send me a copy of her database and the support files for the responder kit and I finally had time to look into it this week. We won’t discuss how I managed to…
-
There’s a reason that log analytics programs, like Splunk, Data Dog and Sumo Logic are so popular. Even Microsoft has a Log Analytics product, but the important message here is log data is massive and parsing through it to find important information can be a bit of a pain. The second word in Log Analytics IS “analytics”. Due to this, the first thought when faced with the number of logs from many complex Power BI environments that people are building, (multiple data sources, multiple data centers, SSRS, Power BI, etc) was to load the logs into Power BI. I’ve been…
-
Power BI, like many Microsoft products, is multi-threaded. This can be seen from the logs and even the Task Manager. I know, I know…you’ve probably heard this part all before… The importance of this information, is that the logs will display Process IDs, (PID) that are separate from the main Power BI Desktop executable, including the secondary processes.. Moving from the Power BI logs that reside in the Performance folder, (see Part I here) we can view and connect the PIDs and TID, (Transaction IDs) to information from the Task Manager and the data displayed: Note that I’ve highlighted the…
-
So we went over locations and the basics of logging and tracing in Power BI. I now want to know how to make more sense from the data. In Oracle, we use a utility called TKProf, (along with others and a number of third party tools) to make sense of what comes from the logs. SQL Server has Log Analytics and the profiler, but what can I do with Power BI? First, let’s discuss what happens when we have actual activity. In my first post, the system was pretty static. This time I chose to open up a file with…
-
Knowing where log files are and how to turn on debugging is an essential part of any technical job and this goes for Power BI, too. Remember, as I learn, so does everyone else….Come on, pretty please? Power BI Desktop Log files and traces can be accessed one of two ways- Via the Power BI Application Via File Explorer In the Power BI application, go to File –> Options and Settings –> Options –> Diagnostics. Crash and dump files are automatically stored with an option to disable them from this screen, but unsure why you’d ever want to do this. …
-
Today’s Post is brought to you by Patrick LeBlanc of Guy in a Cube. I learn best by doing, so I was working with different features while watching along on Quick Measures: As a newbie, yes, I had problems with my quick measures just as Patrick said I would, but with a twist- It wasn’t that I didn’t want to learn DAX, quite the opposite, I could get the expression to work just fine with DAX, but couldn’t seem to get the hang of the quick measure. Leave it to me to have challenges with the *simpler* method… 🙂 Its…
-
Presenting data in the format to ease visualization is required for any BI product. Power BI provides much of this with Data Analysis Expressions, (DAX). As a DBA, I admit to cringing every time a reference was made how similar it is to functions in Excel or other non-database platforms. I’m a DBA and I naturally am going to see data at a much larger, more complex level. I love the simplicity of DAX, which granted me the ability to acquire basic skills using it in just a day, but considering Power BI’s ability to pull from multiple data…
-
I can be an extremely impatient person about anything I think should be faster. I’m diving in deep with Power BI and for most of the early on lessons, the data sources used are Excel and…ahem…Microsoft Access. I don’t know a DBA alive that enjoys working with Access. Its great for the common user to have a database application, but we can barely use the words “Access” and “Database” in the same sentence. In my heart, I will always be a performance person and working with Power BI desktop with Microsoft Access is enough to make you want to throw…